What Is Infrastructure Monitoring and Why It Matters

Infrastructure monitoring is the art and science of collecting, analyzing, and visualizing data from your entire IT environment to make sure everything is ticking along nicely. Think of it as the digital command center for your business, giving you the visibility to prevent crashes, fix problems before they impact users, and keep your operations at peak performance.
The Unseen Engine Keeping Your Business Online
Imagine hopping into your car for a road trip, but the dashboard is completely blank. No speedometer, no fuel gauge, no engine temperature. You'd be driving blind, just hoping you don't run out of gas or overheat on the highway.
Running a modern business without infrastructure monitoring is exactly that risky. You're essentially flying blind.
This proactive oversight acts as the nervous system for your entire tech stack. It's constantly checking the pulse of every single component that your business relies on—from the physical servers humming away in a data center to the cloud services hosting your app and the networks connecting your teams. It’s all about getting a complete, real-time picture of your operational health.
Why It's More Than Just Watching Servers
Truly effective infrastructure monitoring goes way beyond a simple "is the server up or down?" alert. It provides deep, actionable insights into how your systems are performing, allowing your team to spot the subtle warning signs of trouble long before they blow up into a full-blown outage.
This means tracking the right metrics to understand how resources are being used and how your applications are behaving under pressure. The whole point is to shift from a reactive, "firefighting" mode to a proactive state where you're constantly tuning and optimizing. For a deeper dive into these strategies, check out our guide on infrastructure monitoring best practices.
By continuously gathering and analyzing performance data, organizations can ensure system reliability, optimize resource allocation, and ultimately deliver a superior customer experience. This isn't just a technical task; it's a fundamental business strategy.
This constant vigilance helps you answer critical questions in minutes, not hours:
- Is our website slowing down for customers in a specific region?
- Are we about to max out the storage on a critical database?
- Did that last software update cause an unexpected spike in CPU usage?
Answering these questions quickly is what separates a resilient, reliable business from one that's constantly scrambling to fix unexpected downtime.
Why Proactive Monitoring Is No Longer Optional
For a long time, plenty of teams lived by a simple mantra: "if it ain't broke, don't fix it." That reactive approach, where you only jump in after something has already caused an outage, is a recipe for disaster in today's world. Just waiting for a failure to happen isn't a viable strategy anymore—it's a direct path to lost revenue, unhappy customers, and a tarnished reputation.
The cost of sitting back and waiting is real, and it can be severe. Imagine an e-commerce site crashing during a huge sale. Every single minute of downtime means lost sales and chipped-away customer trust. It's not just about complete outages, either. A slow, sluggish application can drive users away long before it ever fully breaks. Proactive monitoring completely flips that script.
Shifting from Firefighting to Prevention
Instead of frantically trying to put out a fire, think of proactive monitoring as a top-notch fire prevention system. It's constantly looking for sparks—things like weird memory spikes or rising network latency—and gives you a heads-up so you can deal with the cause before it erupts into a full-blown crisis.
This kind of preventative shield is especially critical for any organization relying on older, aging infrastructure. Those systems often hide vulnerabilities and performance bottlenecks that can creep up on you. They might be the foundation of your business, but their health can degrade silently. Monitoring gives you the visibility you need to manage those risks before they bite you.
The market is taking notice, too. The global infrastructure monitoring market was recently valued at USD 4.51 billion and is expected to climb to USD 10.26 billion by 2030. That growth is all about the urgent need to protect both aging systems and new investments. You can find more details on this growing market on grandviewresearch.com.
Proactive monitoring shifts your entire posture from reactive and defensive to strategic and forward-thinking. It’s the difference between being controlled by your infrastructure and being in control of it.
The Business Case for Constant Vigilance
At the end of the day, proactive infrastructure monitoring gives you a clear competitive edge. It helps you deliver a stable, reliable experience for your users, which is the bedrock of customer loyalty. By keeping an eye on performance trends and setting baselines, you can make smarter calls on capacity planning, how you allocate resources, and what future upgrades you really need.
This forward-looking visibility brings a ton of benefits:
- Improved User Experience: Fast and reliable services keep people coming back.
- Enhanced Brand Reputation: Fewer outages and slowdowns build trust.
- Greater Operational Resilience: You can see problems coming and head them off before they impact the business.
This strategic oversight shares a lot of DNA with modern software development practices like continuous integration, where constant feedback is key to keeping a codebase healthy. If you're curious, you can check out our simple guide to what continuous integration is in our related article. Staying ahead of the competition really starts with knowing what’s going on under the hood at all times.
Understanding the Core Components of a Monitoring System
To really get what infrastructure monitoring is all about, it helps to look under the hood. Think of it like a finely tuned production line: raw materials come in, get processed, checked for quality, and then presented as a finished product. Each step is separate, but they all work together seamlessly.
An effective monitoring system follows a similar, four-stage process. This structure is what turns the overwhelming flood of data from your IT environment from chaotic noise into clear, actionable intelligence your team can actually use.
Step 1: Data Collection
Everything starts with data collection. This is where the monitoring system acts like a network of sensors, grabbing vital signs from every corner of your infrastructure. It needs to pull in metrics, logs, and traces from servers, applications, databases, and all the network gear in between.
This usually happens in one of two ways:
- Agent-based monitoring means installing a small piece of software—an agent—right onto a server or host. This agent gets an inside look at the system's internal state, collecting detailed data on things like CPU usage, memory, and running processes.
- Agentless monitoring gathers data remotely, talking to devices using standard protocols like SNMP or WMI. It's less intrusive, which makes it perfect for monitoring network hardware or appliances where you can't just install an agent.
No matter the method, the goal is the same: gather a rich, continuous stream of telemetry. This raw data is the fuel for the entire monitoring process.
Step 2: Data Storage and Processing
Once all that data is collected, it needs a place to live. The data storage component is like a specialized, high-performance warehouse. You can't just dump this information into any old database; it has to be one optimized for time-series data, meaning it's built to handle billions of data points, each with a specific timestamp.
This is what allows the system to store historical performance data efficiently. Without that historical context, you have no way to spot trends, establish a baseline for normal performance, or know if a sudden spike is a real problem or just business as usual.
Step 3: Analysis and Alerting
This is the brain of the whole operation. The analysis and alerting engine is constantly sifting through all the incoming data, checking it against predefined thresholds and historical norms. This is where the system decides if something is actually wrong.
A well-configured alerting system is the difference between proactive problem-solving and reactive firefighting. It turns raw data into a clear signal, telling your team exactly where to focus their attention before a minor issue becomes a major outage.
Modern systems don't just look for simple threshold breaches. They use sophisticated algorithms to detect anomalies and spot emerging patterns that could point to future problems, then trigger alerts. Those alerts get routed to the right teams through tools like Slack, email, or PagerDuty, making sure someone jumps on the issue right away.
Step 4: Visualization and Reporting
At the end of the day, raw numbers and logs are incredibly hard for humans to make sense of. The visualization component translates all this complex data into intuitive dashboards, graphs, and reports. This is the user interface of the monitoring system, where engineers can see the health of the entire infrastructure at a glance.
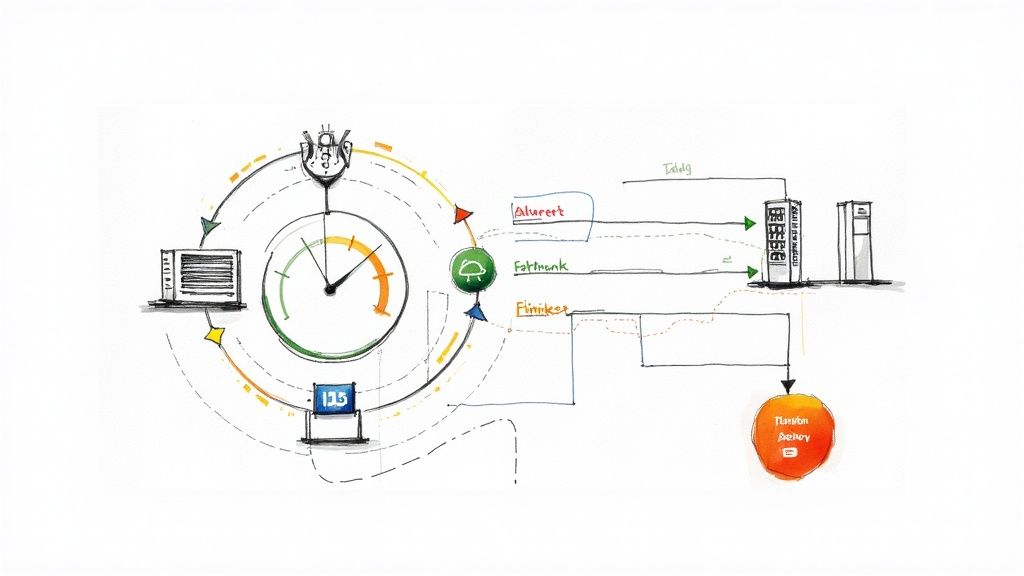
This flow shows how metric collection, automated alerts, and incident resolution all work together.
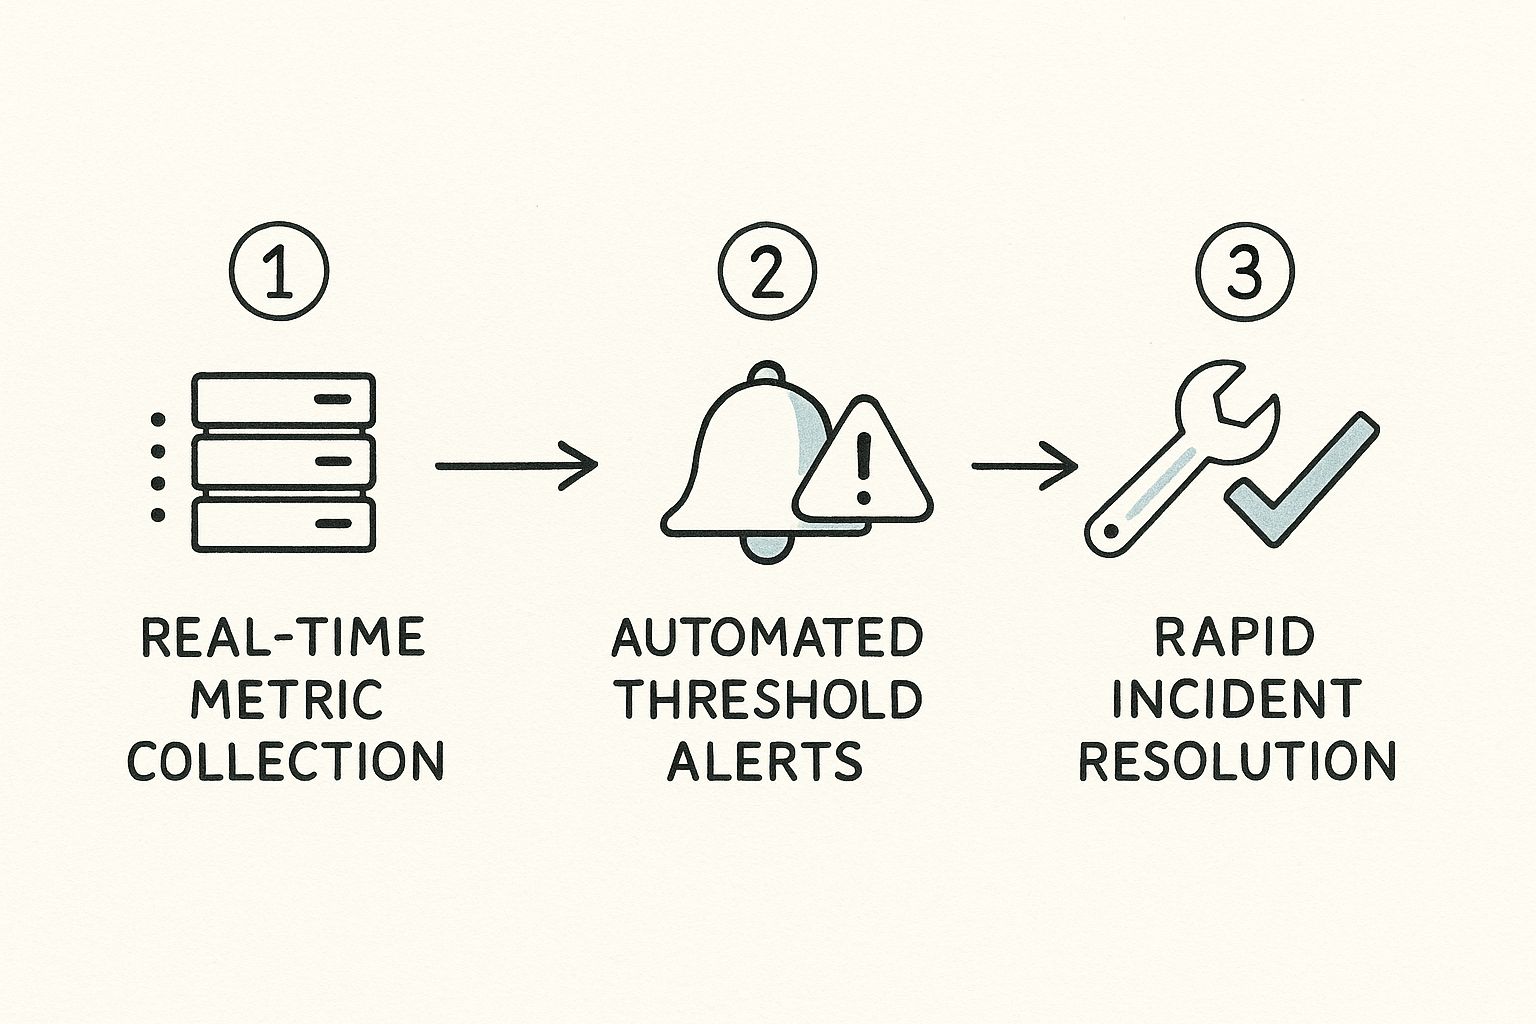
As you can see, effective monitoring isn't a one-and-done task; it's a continuous cycle. It moves from real-time data gathering to automated detection and, finally, to swift resolution. These dashboards empower teams to correlate different metrics, drill down into specific incidents, and understand the impact of system changes over time. It's what turns data into decisive action.
The Essential Metrics You Need to Track

Trying to monitor every single data point your systems spit out is a fast track to getting overwhelmed. It’s like trying to listen to every conversation in a crowded room at once—you just end up with a wall of noise. The secret to effective infrastructure monitoring isn't about collecting more data; it's about focusing on the right data.
Think of these core metrics as the vital signs for your system's health. By zeroing in on a handful of key indicators, you can get a true pulse on what's happening under the hood, quickly spot trouble, and cut through the noise to find the root cause.
Server and Compute Metrics
At the very heart of your infrastructure are the servers and compute resources doing all the heavy lifting. These metrics tell you how hard your foundational components are working and if they're about to hit their limits. Honestly, keeping a close eye here is your first line of defense against system-wide slowdowns and outright crashes.
Here are the non-negotiables:
- CPU Utilization: This is a direct measure of how much of your processor's power is being used. If you see this consistently pinned above 80%, it’s a big red flag that a server is overworked and will start dragging down the performance of every application on it.
- Memory (RAM) Usage: This shows you how much of the system's active memory is occupied. When RAM gets too full, the system starts "swapping" to disk, which is painfully slow and can bring applications to a grinding halt.
- Disk I/O (Input/Output): This tracks how fast data is being read from and written to your disks. High latency here can create a massive bottleneck, especially for anything that relies heavily on a database.
- Disk Space: It sounds simple, but it's absolutely critical. Running out of disk space can cause applications—and sometimes the entire OS—to fail in spectacular and unexpected ways.
A sudden spike in CPU right after a new deployment? That's not a coincidence. It’s a clear signal that the new code might have a serious performance issue.
By monitoring these core compute metrics, you move from guessing to knowing. You can finally answer the question: "Is it a code problem or a hardware problem?"
Network Performance Metrics
Your infrastructure is only as reliable as the network connecting everything together. The tricky thing about network issues is that they often masquerade as application problems, making them notoriously difficult to diagnose without the right data. Monitoring your network ensures data is flowing smoothly between servers, services, and, most importantly, your users.
Key metrics to keep on your radar:
- Latency: This is the round-trip time for a packet of data. High latency translates directly to delays, which users experience as lag or general sluggishness.
- Packet Loss: This counts the percentage of data packets that get lost in transit and have to be resent. Even a small amount of packet loss can wreck the performance of real-time applications like video calls or online gaming.
- Bandwidth: This is the capacity of your network pipeline. Maxing out your bandwidth is like hitting a traffic jam on the freeway—everything slows to a crawl.
Application Health Metrics
Finally, you have to monitor the applications themselves. These metrics give you a direct window into the user experience. Your servers and network can look perfectly healthy on paper, but if the application is struggling, your users are still having a bad time.
This is where the rubber meets the road:
- Error Rate: The percentage of requests that end in an error. A sudden jump in this number is often the very first sign that something is seriously wrong.
- Response Time (or Application Latency): How long it takes for your application to respond to a user's request. Slow response times are a direct cause of customer frustration and can absolutely hurt your bottom line.
Critical Infrastructure Metrics and Their Meaning
To put it all together, you need a clear view of what's important across each layer of your stack. Think of this as your cheat sheet for interpreting your system's vital signs.
| Metric Category | Key Metric | What It Tells You | Potential Problem If High/Low |
|---|---|---|---|
| Server/Compute | CPU Utilization | How busy your processor is. | High: Overloaded server, inefficient code. |
| Server/Compute | Memory Usage | How much RAM is being used. | High: Risk of slow disk swapping, out-of-memory errors. |
| Server/Compute | Disk I/O Wait | Time the CPU waits for disk operations. | High: Storage bottleneck, slow database queries. |
| Network | Latency | Delay in data transmission. | High: Slow application response, poor user experience. |
| Network | Packet Loss | Percentage of data lost in transit. | High: Degraded performance, connection timeouts. |
| Application | Error Rate | Percentage of failed requests. | High: Bugs in code, failing dependencies, bad deployment. |
| Application | Response Time | How long a request takes to process. | High: Inefficient code, overloaded database, user frustration. |
Focusing on these key metrics helps you separate the signal from the noise. It allows your team to stop chasing ghosts and start fixing real problems before they impact your users.
The Future of Monitoring: AI, Automation, and a Little Bit of Fortune-Telling
Infrastructure monitoring is evolving far beyond just flagging problems after they’ve happened. We’re moving into an intelligent, automated era where systems don't just report issues—they see them coming. The driving force behind this shift is AIOps (AI for IT Operations), an approach that uses machine learning to get ahead of trouble before it ever impacts your business.
Instead of waking up to a server crash alert, imagine getting a heads-up hours in advance. Modern monitoring systems sift through historical data, spot the subtle patterns that scream “imminent failure,” and warn you. This flips the script entirely, turning monitoring from a reactive chore into a proactive strategy.
Intelligent Systems and Digital Twins
This leap forward is getting a serious boost from IoT and virtualization. One of the biggest game-changers here is the concept of a digital twin—a perfect virtual replica of a physical system or asset. By feeding this digital model with real-time data from its physical counterpart, engineers can run stress tests, simulate updates, and diagnose problems without ever touching the live production environment.
When you pair this with physical infrastructure, things get really interesting. For example:
- Smart sensors on a data center's cooling units can predict a failure just by picking up on tiny vibrations or temperature shifts.
- IoT devices on network hardware can report performance degradation long before a full-blown outage ever occurs.
By combining AI-driven analytics with a constant stream of data from both digital and physical sources, we can now manage incredibly complex systems with a level of foresight that used to be pure science fiction. Maintenance becomes a planned, scheduled activity, not a frantic, late-night fire drill.
The Booming Market for Smart Monitoring
It’s no surprise the industry is pouring money into these advanced capabilities. Wireless tech has become the backbone for the real-time data collection that powers predictive maintenance and keeps things safe. As a result, the infrastructure monitoring market was recently valued at a whopping USD 7.95 billion and is on track to hit nearly USD 12.86 billion by 2030. You can dig into more of the data on this expansion from the market intelligence experts at mordorintelligence.com.
This growth isn't just a number; it signals a fundamental change. The future of monitoring isn’t about having more dashboards. It’s about building smarter systems that deliver deep, actionable insights. As our IT environments get exponentially more complex, automation and AI are becoming the only way to maintain the peak performance and reliability we all depend on.
Putting Your Monitoring Strategy into Practice
Knowing the theory is one thing, but putting it into practice is where the real work begins. A successful monitoring strategy isn't just about collecting dashboards; it's about building a culture of proactive oversight. You need a clear, actionable roadmap that your whole team can actually follow.
A huge part of this is establishing your performance baselines. Think about it: you can't spot something weird if you don't know what "normal" looks like. By tracking key metrics over time, you define your system's standard operating behavior, which makes spotting anomalies far more reliable.
Key Implementation Steps
To build a monitoring framework that actually works, you need to turn all that raw data into meaningful actions. These foundational practices are what prevent downtime and drive real improvement.
- Define Meaningful Alerts: Don't fall into the "alert fatigue" trap, where engineers start ignoring a constant flood of notifications. Configure alerts that are specific, actionable, and tied directly to potential business impact. If it's not a real problem, it shouldn't be an alert.
- Choose the Right Tools: Pick monitoring tools that genuinely fit your tech stack and can grow with you. Whether you need deep insights into your containers or a broad view of your network, the right platform makes a world of difference.
- Integrate with Your Workflow: Monitoring shouldn't be a siloed task. Weave it directly into your development process, especially your CI/CD pipeline. This ensures performance is a consideration from the very start. For more on this, check out our CI/CD pipeline best practices.
By focusing on actionable alerts and defining clear performance baselines, you transform monitoring from a reactive chore into a strategic tool for operational excellence and continuous improvement.
Investing in these practices is becoming non-negotiable. The global infrastructure monitoring market was valued at USD 5.59 billion and is projected to hit USD 15.70 billion within a decade. This growth underscores just how critical monitoring has become for keeping systems safe, reliable, and performant.
Frequently Asked Questions
Even once you get the hang of infrastructure monitoring, a few practical questions always seem to pop up. Let's tackle the most common ones to connect the dots between theory and what you'll actually be doing day-to-day.
Monitoring vs. Observability: What's the Difference?
This one trips a lot of people up, but it's simpler than it sounds.
Think of monitoring as asking your system specific questions you already know are important. You're checking things like, "What's the current CPU usage?" or "Is the database responding?" It's all about tracking known metrics against set thresholds to see if something has gone wrong.
Observability, on the other hand, is what lets you ask any question about your system, especially the ones you never thought to ask beforehand. It pieces together logs, metrics, and traces so you can dig into unexpected issues and truly understand the "why" behind a problem, not just the "what."
Monitoring tells you a server is down. Observability helps you figure out why it went down without any warning.
What Are the First Steps to Start Monitoring?
Jumping into infrastructure monitoring doesn't have to be a massive project. The best way to start is to think small and build from there, focusing on what keeps your business running.
Here’s a simple three-step plan to get going:
- Identify Critical Systems: First, pinpoint the top 3-5 components that are absolutely essential. This could be your main web server, your primary database, or a crucial API. If it goes down, everyone feels it.
- Track Core Metrics: For those systems, start tracking the basics—CPU usage, memory, disk space, and simple network latency. These are the vital signs that give you an immediate health check.
- Set Simple Alerts: You don't need a complex alerting strategy at first. Just set up notifications for obvious problems, like a server's CPU usage staying above 90% for more than five minutes or disk space dropping below 10%.
By focusing on your most vital systems first, you get immediate, high-value visibility without the complexity of trying to monitor everything at once. This iterative approach ensures your monitoring strategy grows with your needs.
Ready to get a handle on your CI and eliminate infrastructure headaches? Mergify's CI Insights uses AI to detect and categorize infrastructure problems, so your developers can stop guessing and start fixing. Learn more at https://mergify.com.