Software Quality Metrics: Key Measures for Better Code

Why Your Code Needs A Health Checkup

Think of software quality metrics as a fitness tracker for your code. Just as athletes track their vitals to improve performance, developers use metrics to understand the health of their code. This isn't about creating reports; it's about having an ongoing dialogue with your codebase.
Imagine building a house without inspecting the foundation or wiring. You might end up with a pretty facade, but hidden problems could lead to disaster. Ignoring software quality metrics is similar; it creates a blind spot. Your application might look fine, but issues with maintainability, reliability, and security could be lurking beneath the surface.
Effective teams use metrics as an early warning system. They help spot problems before they become major issues. It’s like noticing a strange noise in your car engine. Catching it early might be a simple fix; ignoring it could mean a costly repair. Metrics work the same way, letting you address minor code issues early through refactoring before they become huge headaches. This allows your team to deal with technical debt, improve maintainability, and enhance the codebase's health.
Understanding Cyclomatic Complexity
Cyclomatic Complexity is a key software quality metric. It measures the complexity of your code by analyzing the number of different paths through it, considering things like if-else statements, loops, and switch cases. A higher Cyclomatic Complexity score means more paths, and more paths mean the code is harder to test, maintain, and understand.
For example, a score of 10 indicates many paths that need individual testing, which increases the time and effort needed for maintenance. Understanding and managing this complexity helps developers identify potential problem areas and prioritize refactoring. Learn more about Cyclomatic Complexity here. You can also check out Continuous Integration Best Practices from Mergify. Remember, collecting metrics is just the first step; the real power comes from interpreting and using those insights to improve your development process and deliver a better product.
Decoding The Five Pillars Of Software Quality
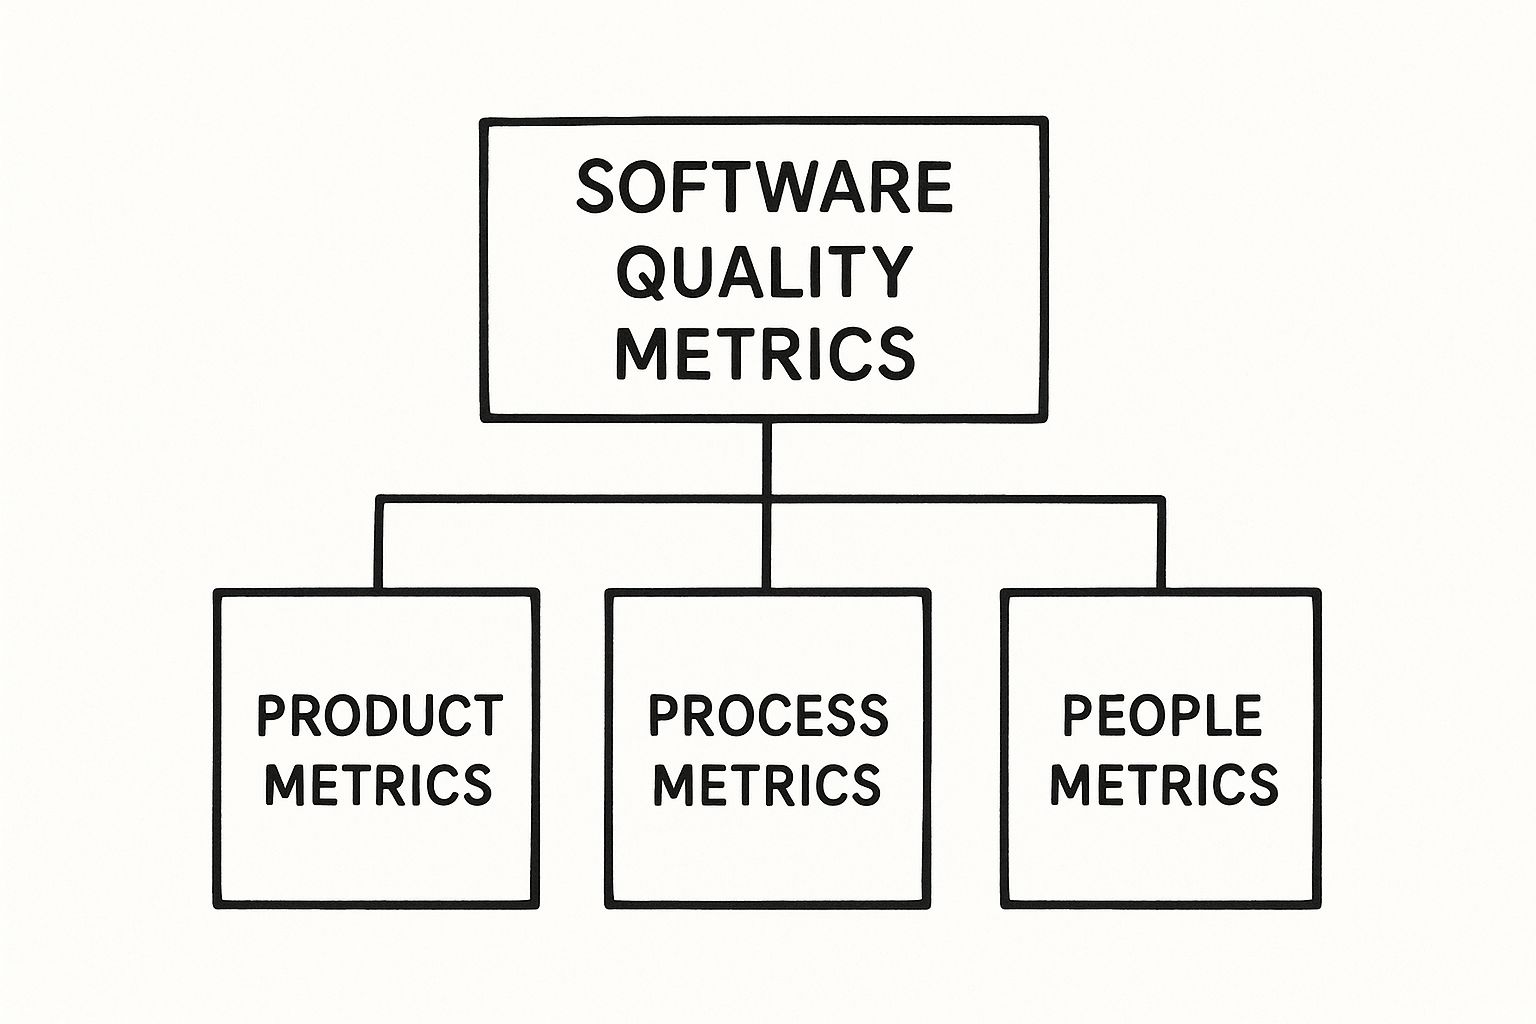
This infographic nicely visualizes how we can think about software quality metrics. It organizes them into Product, Process, and People Metrics, showing how these categories are all interconnected. This highlights a crucial point: software quality isn't just about clean code. It's also about how we build it and who's building it. Effective metrics consider all three for a complete picture of project health.
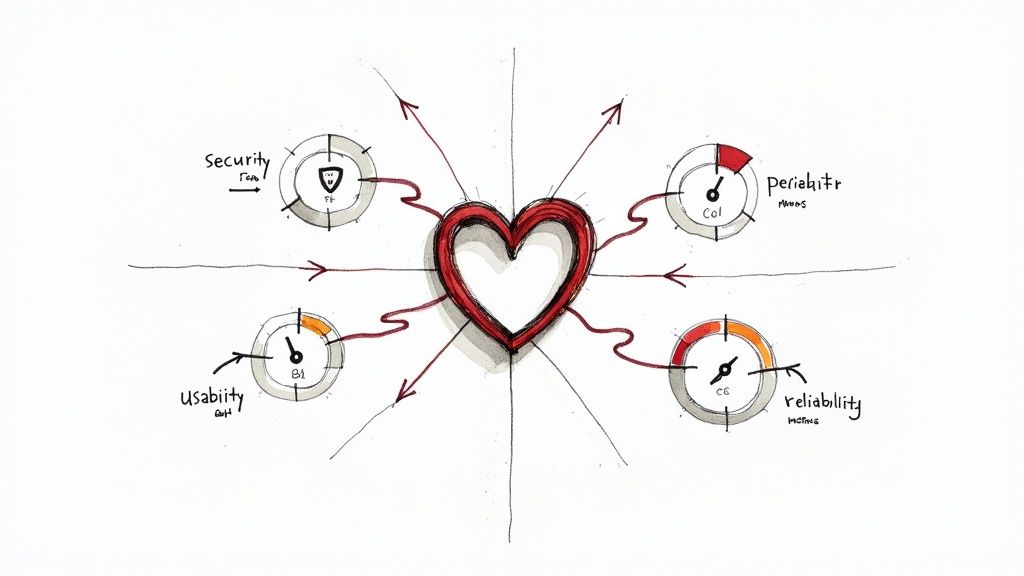
Think of it like constructing a building. You need a solid foundation, reliable materials, and skilled builders. Similarly, high-quality software relies on maintainability, reliability, performance, security, and usability. These five pillars work together, and neglecting one can weaken the others. Imagine focusing solely on performance and overlooking security – you might end up with a fast but vulnerable system. The best teams understand the need for balance.
Understanding The Interplay of Quality Pillars
Let's use the analogy of a high-performance sports car. It might be blazing fast, but what if it constantly breaks down (poor reliability) or is difficult to control (poor usability)? Its overall quality is definitely in question. Software is similar. It can be lightning-fast, but if the interface is confusing or it's riddled with security holes, its usability and security suffer.
This means our quality metrics need to address all five pillars. For example, maintainability, reflected in metrics like Cyclomatic Complexity and code churn, makes future changes easier and less likely to introduce bugs. Reliability, measured by metrics like Mean Time to Recovery (MTTR) and change failure rate, tells us how well the software handles unexpected problems.
Measuring The Five Pillars
Then there's performance, measured by things like response time and throughput. These metrics tell us how quickly the software reacts to user actions. Security metrics, such as the number of vulnerabilities and time to resolve them, show us how well the software resists attacks. Finally, usability is measured through things like user surveys and task completion rates, assessing how easily users can achieve their goals.
To better understand how these dimensions relate, let's look at the following table:
Core Software Quality Dimensions Comparison
A breakdown of the five essential quality dimensions, their key metrics, and impact on development
| Quality Dimension | Primary Metrics | Impact on Development | Measurement Frequency |
|---|---|---|---|
| Maintainability | Cyclomatic Complexity, Code Churn | Easier modifications, reduced bug introduction | Continuously (with each code change) |
| Reliability | MTTR, Change Failure Rate | System stability, reduced downtime | Continuously (during testing and production) |
| Performance | Response Time, Throughput | User experience, system efficiency | Continuously (during testing and production) |
| Security | Number of Vulnerabilities, Time to Resolve | Protection against threats, data integrity | Continuously (security scans, penetration testing) |
| Usability | User Surveys, Task Completion Rates | User satisfaction, product effectiveness | Regularly (user testing, feedback collection) |
As this table shows, each pillar gives us a unique perspective on quality. And these pillars often influence each other. A highly maintainable codebase, for example, is more likely to be reliable and secure because it's easier to fix bugs and implement security patches. This reinforces the idea that comprehensive quality metrics need to consider all these vital signs to accurately assess software health.
The Metrics That Actually Move The Needle

This screenshot shows GitHub Actions, a popular CI/CD tool. It highlights how we can automate various workflows, like quality checks, directly within the development process. Visually, you can see how different tools and processes integrate, creating a smoother, more efficient way to build and deploy code. This really emphasizes how quality metrics should be baked right into the development lifecycle.
Let’s talk about a few software quality metrics that truly matter. Instead of thinking of these as just numbers, imagine them as the vital signs of your codebase. Take code coverage, for example. Many people get caught up in hitting a specific percentage, but it becomes much more powerful when you link it to how effective your tests actually are. Instead of chasing that elusive 100% coverage number, make sure your tests are finding the bugs that matter. This shifts the focus from quantity to quality.
Beyond Code Coverage: Measuring Test Effectiveness
This shift in thinking means tracking things like your mutation testing score. Think of this metric as measuring how good your tests are at finding and eliminating “mutants” – these are basically tiny, intentional defects introduced into your code. A high mutation score tells you your tests are doing a good job of uncovering vulnerabilities. Another useful metric is the number of bugs found per 1,000 lines of code, also known as defect density. Watching this metric over time can reveal interesting trends in your code quality and even help you predict potential reliability issues before they impact your users.
For example, if your defect density keeps climbing even though you have high code coverage, it might be a sign that your tests aren’t catching real-world bugs. This insight should prompt you to re-evaluate your testing approach and tweak those test cases to target genuine vulnerabilities. It also helps avoid the trap of thinking your code is high quality just because you hit a certain coverage percentage.
Taming Technical Debt With Meaningful Metrics
Technical debt is another crucial metric. But rather than just calculating its theoretical cost in dollars, track actionable metrics that can inform your refactoring decisions. This could be things like the number of code smells, the time spent fixing technical debt versus building new features, or the number of modules with high Cyclomatic Complexity. These metrics give you a practical understanding of how technical debt affects your development speed and the maintainability of your code.
Let’s say a particular module consistently has high Cyclomatic Complexity and eats up a lot of refactoring time. You can then prioritize addressing the technical debt in that module. This targeted approach leads to measurable improvements in how easily you can maintain your code and lowers future development costs. This proves that improvements in quality directly translate into real business value.
Metrics in Action: A Real-World Example
Imagine a team building a new payment gateway. They have a great code coverage number of 95%, but users are running into errors during checkout. When they dig into their defect density, they discover a high number of bugs related to handling specific edge cases in payment processing. Their current tests, despite high coverage, missed these edge cases. By focusing their tests on these scenarios, they bring down both their defect density and the number of customer-reported errors. At the same time, they start tracking the time spent fixing payment gateway bugs. This reveals the hidden costs of inadequate testing and highlights the importance of focusing on the right quality metrics.
Automating Quality Checks In Your Development Pipeline
Building reliable software isn't just about writing code; it's about ensuring that code is high-quality. Automating quality checks within your CI/CD pipeline is like having a dedicated quality control team working around the clock. Think of your pipeline as a factory assembly line. Each step adds a new component to your product, and automated quality checks are the inspectors ensuring each part meets the required standards before moving down the line.
This continuous inspection process provides immediate feedback to developers. It's like having a helpful colleague looking over your shoulder, pointing out potential issues before they become major headaches. This early feedback loop empowers developers to make better decisions and write cleaner code from the get-go.
Implementing Quality Gates in Your CI/CD Workflow
This early intervention is called "shift-left" testing. Instead of discovering bugs late in the development cycle, automated quality checks act as gatekeepers at each stage of the pipeline. Imagine these checks as automated gates that only open when the code meets predefined quality standards.
This proactive approach prevents bad code from progressing through the pipeline. It's like catching a faulty component on the assembly line before it reaches the final product. This saves time, reduces frustration, and drastically lowers the cost of fixing bugs later on.
How do you implement these quality gates? Popular CI/CD tools like GitHub Actions, Jenkins, and GitLab CI allow you to configure automated checks triggered by each code commit. These checks can evaluate software quality metrics such as code complexity, code churn, and test coverage.
You can set thresholds for these metrics. If the code doesn't meet the standards, the pipeline stops, and the developer receives an immediate alert. This ensures that only quality code proceeds to the next stage, fostering a higher standard throughout the development process.
Automating Quality-Based Merge Decisions
Automation can do more than just check metrics; it can also automate decisions. Tools like Mergify intelligently automate merge decisions based on quality criteria.
Think of it as an automated gatekeeper for your code merges. If a pull request satisfies all quality requirements – tests pass, code quality is good, and other conditions are met – Mergify can automatically merge it. This streamlines your workflow, freeing up developers to focus on coding rather than managing merges.
This eliminates manual intervention and speeds up the development process without sacrificing quality. For more information, check out this article on Automated Regression Testing.
This screenshot from Mergify shows their automated merge queue. It visually represents pull requests waiting to be merged. Mergify automatically handles the merging process based on pre-defined rules and quality checks, making merging efficient and reliable.
Let's look at some tools that help integrate quality metrics into your CI/CD workflow. The table below offers a quick comparison of their features and capabilities.
To help you navigate the world of CI/CD quality integration tools, we've put together a handy comparison table.
CI/CD Quality Integration Tools Comparison
| Tool | Supported Metrics | Integration Complexity | Cost Model | Best Use Case |
|---|---|---|---|---|
| GitHub Actions | Code complexity, test coverage, code churn, security scanning | Relatively simple, well-documented | Based on usage minutes | Open-source projects, small to medium-sized teams |
| Jenkins | Highly customizable; supports a vast range of metrics through plugins | Can be complex depending on plugin ecosystem | Open-source, self-hosted; requires infrastructure management | Large teams, complex projects, high customization needs |
| GitLab CI | Code complexity, test coverage, code churn, security scanning, container scanning | Integrated within GitLab ecosystem; relatively straightforward | Tiered plans based on features and usage | Teams already using GitLab, streamlined integration |
| Mergify | Primarily focused on merge queue management; integrates with other tools for quality metrics | Simple integration through webhooks and APIs | Subscription-based, tiered plans | Teams focused on automating merge processes and workflows |
As you can see, various tools cater to different needs and project complexities. Choosing the right tool depends on your team’s specific requirements and workflow preferences.
Gradual Integration for Smooth Adoption
Integrating automated quality checks should be a gradual process. Don't try to implement everything at once. Start small by focusing on a few key metrics that address your most pressing quality concerns. It's like adding new quality checks to one part of the assembly line before rolling them out factory-wide.
As your team adapts and gains confidence, gradually introduce more checks. This measured approach avoids overwhelming developers and fosters a culture of continuous improvement without disrupting existing workflows. This ensures that automation enhances, rather than hinders, your development process.
Reading Your Code's Story Through Data

Collecting software quality metrics is like baking a cake. You can have all the finest ingredients, but without a good recipe and understanding of how to use them, you won't end up with a delicious dessert. Similarly, simply gathering data about your code isn't enough. The real magic happens when you interpret that data, uncovering the story it tells about your software's health. Think of it as detective work, piecing together clues to understand the bigger picture.
The more experienced you become, the better you'll be at spotting patterns in these metrics, identifying both potential problems and opportunities for improvement.
Establishing Meaningful Baselines
Just like a doctor needs a patient's baseline vitals, you need a starting point for your code. Baselines represent the current state of your codebase—warts and all—not some unattainable ideal. They provide a foundation for tracking progress and spotting deviations.
For example, if your current defect density is 0.5 bugs per 1,000 lines of code, that's your baseline. It’s not about immediately matching industry averages or striving for some arbitrary “perfect” score. Trying to reach unrealistic goals right out of the gate can be discouraging for your team. Focus on gradual progress, not instant perfection. Proper planning and management are crucial for ensuring quality in software releases; you can learn more about managing website development project management.
Setting Realistic Targets
With a solid baseline established, you can set realistic targets that challenge your team without being overwhelming. Imagine training for a marathon. You wouldn’t expect to run the full distance on day one. Instead, you'd set achievable milestones along the way.
The same principle applies to software development. If your aim is to reduce defect density, a 10% improvement in the next quarter is more realistic and motivating than a drastic 50% reduction. This gradual approach allows your team to adapt, refine their processes, and build confidence with each small victory. Unrealistic targets often lead to frustration and can even encourage cutting corners to achieve numbers without genuine quality improvements.
Recognizing Warning Signs
Learning to distinguish typical fluctuations from real warning signs is a crucial skill. Your software metrics, like your heart rate, will naturally vary over time. A slight increase in code churn after a major refactoring is often expected.
However, a sustained increase in code churn combined with a rising defect density could signal a deeper issue, perhaps unclear requirements or rushed development practices. The ability to connect these different metrics and interpret them in context comes with experience and a deep understanding of your own development process.
Communicating Quality Insights
Finally, it's essential to communicate your findings effectively to stakeholders. These individuals might not be technical experts, but they need to understand the business impact of your quality efforts. Use clear language and focus on outcomes, not technical jargon.
Instead of saying "we reduced Cyclomatic Complexity by 15%", you could say "we made our code 15% easier to maintain, which will save us time and money on future bug fixes." This approach demonstrates the value of your work in a way everyone can grasp, increasing support for future quality initiatives. By mastering these interpretation and communication skills, you transform software quality metrics from simple numbers into valuable tools for continuous improvement and data-driven decisions.
Creating a Team Culture That Values Quality
Building a team that values quality isn't just about tracking software quality metrics. It's about cultivating an environment where continuous improvement is in the team's DNA. Think of it like a sourdough starter – you need to feed and nurture it consistently for it to thrive and produce delicious bread. Similarly, a thriving quality culture needs constant care and attention. This means shifting the perspective on quality metrics: they’re not an external pressure, but an internal compass guiding the team towards excellence.
Making Quality Visible and Meaningful
First, make quality metrics visible and relevant to everyone, not just the tech leads. Imagine a soccer team where only the coach knows the score. How can the players adjust their strategy if they're in the dark? All team members should understand the meaning of the relevant metrics. This shared understanding creates a sense of collective ownership.
This visibility shouldn't feel like Big Brother, but rather like giving your team the best tools for the job. Think of equipping your team with a top-of-the-line navigation system. It guides them towards their destination (high-quality software) and helps them navigate obstacles (bugs, technical debt) along the way.
Fostering Collaboration Through Retrospectives and Team Goals
Effective quality retrospectives are essential. These aren't about pointing fingers, but about reflecting, learning, and improving together. Think of them like a post-game analysis. The team analyzes what went well, what could be better, and how to adjust their strategy for the next match. Quality retrospectives help identify patterns and generate actionable insights.
Set team goals that focus on knowledge sharing, not individual competition. This encourages mutual support and continuous learning. For example, instead of rewarding the developer with the "cleanest" code, celebrate the team's overall reduction in defect density. This fosters team accomplishment and reinforces the value of collective effort. You can also learn more about improving your code quality.
Building Effective Feedback Loops and Celebrating Quality Wins
Establish clear feedback loops connecting developers' work to real-world outcomes. Just as musicians hear the results of their practice in improved performance, developers should see the direct impact of their quality improvements. For instance, if reducing code complexity leads to fewer customer-reported bugs, that tangible result validates their efforts.
Finally, celebrate quality wins alongside feature releases. Think of it like a band celebrating both individual solos and the overall performance. Recognizing quality improvements motivates teams and reinforces its importance alongside shipping new features. This creates a cycle where quality becomes integral to the development culture, driving continuous improvement and fostering pride in building exceptional software.
Avoiding The Measurement Traps That Derail Teams
Software quality metrics are like a compass, guiding you toward better code. But just like a compass, they can be misleading if you don't know how to use them. Misapplied metrics can send your team wandering in the wilderness, lost and frustrated. Let's explore some common pitfalls and how to avoid them.
The Trap of Gaming the System
It's tempting to focus on the numbers themselves, but that can lead to a dangerous game. Imagine a basketball player only focused on scoring points, ignoring defense and teamwork. Sure, they might rack up impressive stats, but their team is likely to lose. Similarly, focusing solely on hitting metric targets can lead to superficial improvements that don't actually improve the software's quality. For instance, writing tests that don't truly exercise the code just to boost code coverage is like that basketball player padding their stats. It looks good on paper, but it doesn't help the team win.
The Overwhelm of Too Many Metrics
Too much data can be just as bad as not enough. It’s like trying to listen to ten different conversations at once – you won't understand any of them. Overloading your team with metrics creates confusion and dilutes focus. No single metric gets the attention it deserves, rendering your measurement efforts ineffective. Choose a few key metrics that truly matter and concentrate on those. You can always add more later as needed.
The Perfectionism Paradox
Striving for perfect scores can be a trap. It’s like a chef spending hours perfecting a single garnish, while the rest of the meal gets cold. While high standards are important, an obsessive focus on achieving 100% on every metric can hinder progress. For example, pursuing 100% code coverage can consume valuable time that could be spent developing valuable features. Aim for excellence, not unattainable perfection. To cultivate a team that prioritizes quality, resources like Engineering Manager Resume Examples can be valuable.
The Stagnant Metric
Metrics need to evolve with your project. Using an outdated metric is like navigating with an old map – the landscape has changed, and you’ll likely end up lost. As your project progresses, priorities shift, and what was once important may become less so. Regularly review your metrics and retire those that are no longer relevant. This ensures your measurement system remains a useful tool, not a relic of the past.
Focusing on Outcomes, Not Outputs
The key to avoiding these traps is to focus on the "why" behind your metrics. Ask yourself, "What are we trying to achieve?" rather than just "What number are we trying to hit?". This outcome-oriented approach ensures that your metrics are driving real improvement and contributing to building better software. It’s about finding the right balance between speed and quality and constantly adapting your measurement strategy to your team’s evolving needs. It's about creating a culture where everyone is responsible for quality.
Ready to improve your software quality and streamline your development process? Mergify can help your team automate key quality checks and achieve seamless code integration. Visit Mergify to learn more.