Unlocking Software Observability for Modern Systems

Software observability is all about getting a deep, intuitive understanding of your system's inner workings just by looking at what it puts out. Think of it as moving past knowing that something is broken to understanding exactly why it broke. For today's incredibly complex applications, that's not just a nice-to-have—it's essential.
Going Beyond Monitoring to True System Insight

For years, engineering teams got by with traditional monitoring. It's a lot like your car's dashboard. You get alerts for things you already know to look for: your speed, fuel level, and engine temperature. When a light flashes, you know something crossed a line. It’s a solid approach for simple, predictable systems.
But modern software—built with microservices, containers, and serverless functions—isn't a simple car anymore. It’s more like a sprawling, bustling city. A traffic jam on one street can cause unexpected gridlock miles away. In these distributed systems, problems are rarely simple, and you almost never see them coming.
This is where software observability comes in. It's the difference between seeing a "check engine" light and having a full diagnostic tool that tells you the specific fault code, which sensor is failing, and how it’s affecting the engine's performance. Observability gives you the power to ask new questions about your system on the fly, without having to ship new code just to find answers.
Observability is not just a fancier kind of monitoring; it's a completely different way of thinking about system health. It lets teams shift from reacting to problems to proactively exploring the "unknown unknowns"—the strange, new issues that traditional monitoring was never built to catch.
Monitoring vs. Observability at a Glance
To really get the difference, it helps to put them side-by-side. Traditional monitoring is about watching for pre-defined failure states, while observability is about building a system that can be interrogated to understand any state, expected or not.
| Aspect | Traditional Monitoring | Software Observability |
|---|---|---|
| Focus | Tracks known metrics and answers "Is the system up or down?" | Provides context to explore and answers "Why is this happening?" |
| Primary Goal | Alert on predefined thresholds (known unknowns) | Debug novel and unpredictable issues (unknown unknowns) |
| Data | Aggregated time-series data (e.g., CPU %, memory usage) | High-cardinality data: logs, metrics, and traces |
| Approach | Reactive—responds to alerts | Proactive—explores and investigates system behavior |
| Analogy | A car's dashboard lights | A full diagnostics report from a mechanic |
This table captures the fundamental shift in mindset. You're moving from a passive dashboard to an active investigation toolkit.
Why It Matters for Development Teams
Bringing an observability mindset into your team has a direct and massive impact on developer productivity and how resilient your systems are. Instead of spending hours trying to reproduce a bug, engineers can use observability data to follow the exact path of a failed request and find the root cause in minutes.
- Faster Debugging: Quickly find where things went wrong, even in the most tangled, distributed architectures.
- Improved Performance: Pinpoint the subtle performance bottlenecks that are frustrating your users.
- Confident Releases: Understand the real-world impact of your new code the moment it hits production.
With this level of insight, observability becomes more than just a set of tools. It becomes a core practice for building and maintaining reliable, high-performing software. For teams ready to get started, the next logical step is to explore the available DevOps observability tools that can make this a reality.
The Three Pillars of Software Observability
If you want to truly understand a complex software system, you can't just stare at a single dashboard and hope for the best. You need to gather different kinds of signals that, when pieced together, tell a complete story. This is the entire foundation of software observability, and it’s built on three core types of telemetry data known as the "three pillars."
These pillars—Metrics, Logs, and Traces—each answer a different, fundamental question about your system's behavior. Think of it like a team of detectives arriving at a crime scene. One detective quickly assesses the big picture, another examines the detailed evidence left behind, and a third reconstructs the sequence of events. Each one is essential, and together they build a clear narrative of what really happened.
The hierarchy below shows how these three components form the bedrock of observability.
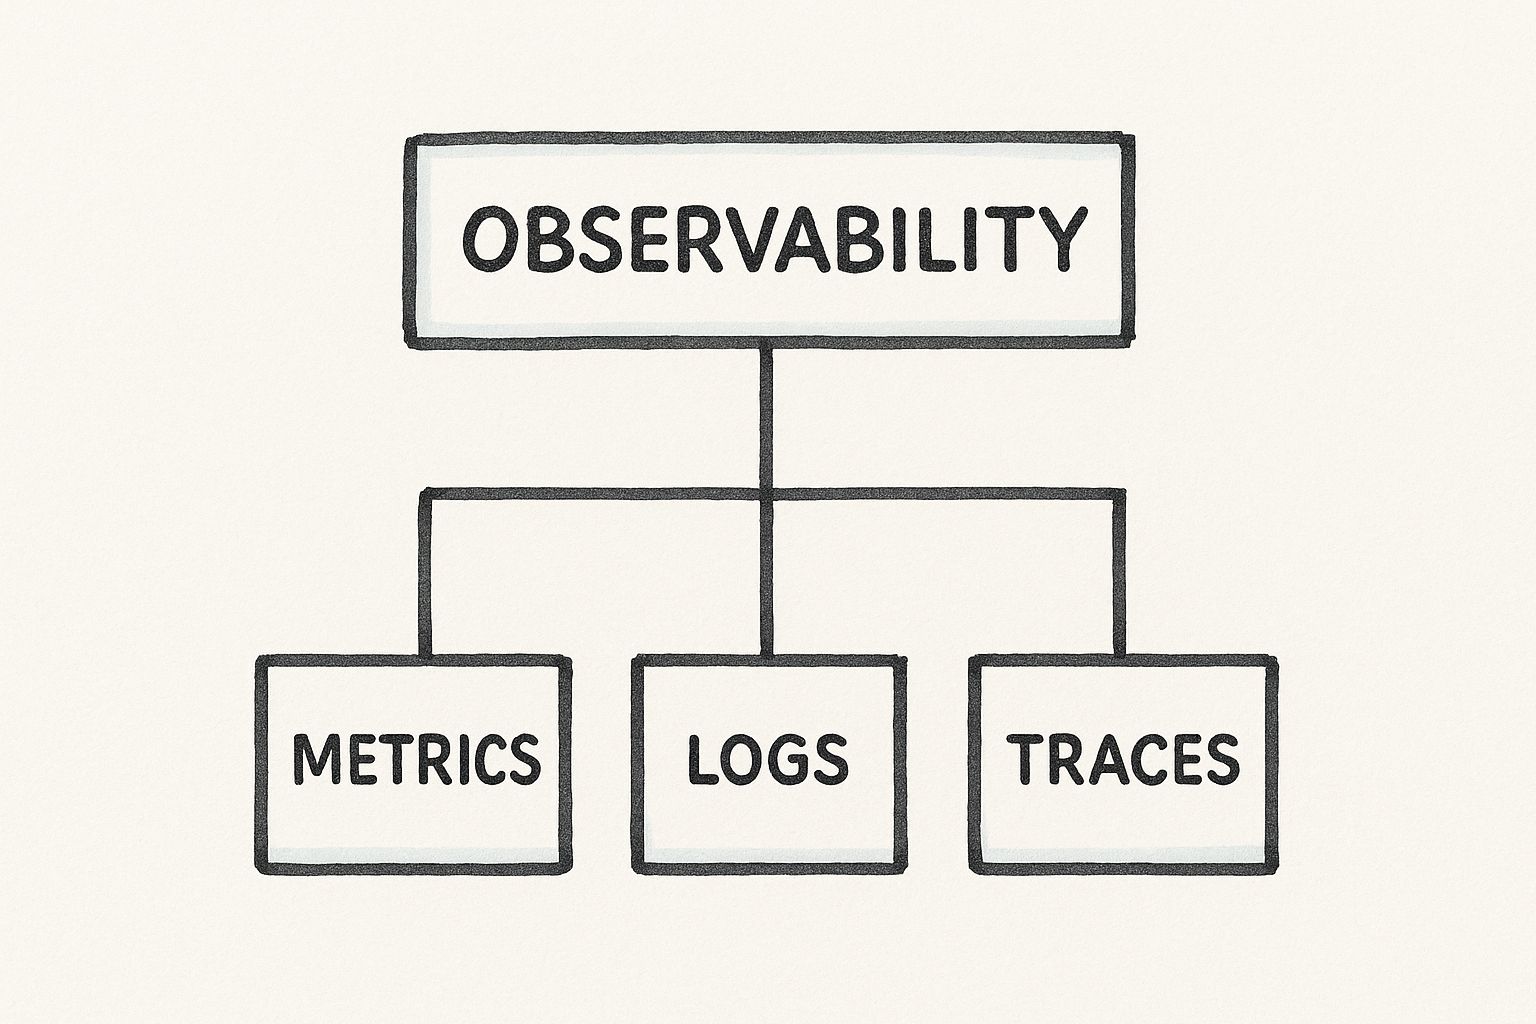
This visual makes it clear: software observability isn't just one thing. It's a practice supported by the distinct yet deeply interconnected data from Metrics, Logs, and Traces.
Metrics: The "What" of Your System
Metrics are the high-level, aggregated numbers that give you a bird's-eye view of your system's health over time. They are almost always the first signal that something might be wrong. If your system were a patient in a hospital, metrics would be the vital signs monitor displaying heart rate, blood pressure, and oxygen levels.
These numbers tell you what is happening. They're lightweight, easy to store, and perfect for building dashboards and alerts. When a metric crosses a pre-defined threshold—for instance, CPU usage smashes past 95% or an error rate suddenly spikes—it triggers an alarm, letting you know it's time to dig in.
Some common examples of metrics include:
- System Metrics: CPU utilization, memory usage, disk space.
- Application Metrics: Request rate, error rate, request latency (like p99 latency).
- Business Metrics: Number of user sign-ups, items added to a cart, or transactions processed per minute.
But metrics alone can't tell you the whole story. They’ll tell you the CPU is high, but they won’t tell you why. For that, you need to go deeper with the next pillar.
Logs: The "Why" Behind the Event
Logs are the nitty-gritty, timestamped records of every single event that occurs within your applications and infrastructure. If metrics are the vital signs, logs are the doctor's detailed clinical notes, describing every observation and action taken. They provide the crucial context that answers the question of why something happened.
Each log entry is an immutable string or, even better, a structured message (like JSON) that captures a specific moment in time. When an alert fires because a metric went haywire, logs are the first place developers turn to hunt for the root cause.
A well-structured log might say, "Timestamp: 2024-10-26T10:00:05Z, Level: ERROR, UserID: 12345, Message: Failed to connect to payment gateway - connection timed out after 3000ms." This single line is incredibly valuable, pointing directly to a potential problem with a third-party service.Modern engineering teams have moved toward structured logs because they are far easier to query and analyze than plain text. This lets teams filter and search through millions of log lines to find that one "needle in the haystack" that explains an outage or a bug. Without logs, you'd know your system was failing, but you'd be completely guessing at the cause.
Traces: The "Where" of the Journey
In today's world of distributed systems, a single user request might travel through dozens of microservices before it's complete. This is where traces become absolutely indispensable. A trace represents the end-to-end journey of a request as it moves through all the different components of your system.
Traces answer the critical question of where a problem occurred. If logs are the notes from individual doctors, a trace is the complete patient chart that follows them from the emergency room to surgery and finally to recovery, documenting every step and interaction along the way.
A trace itself is made up of multiple spans. Each span represents a single unit of work within a service, like an API call or a database query. Each span contains important metadata:
- A service name (e.g.,
auth-serviceorpayment-processor) - Start and end times
- Relevant logs and events that occurred during that specific operation
By stitching these spans together, you get a complete, visual map of the request's lifecycle. This allows you to immediately see which service is slow or throwing an error. For example, a trace might reveal that an e-commerce checkout is taking five seconds, and that 4.5 seconds of that time is spent just waiting on a response from a sluggish inventory service. This level of detail makes it possible to pinpoint performance bottlenecks in complex architectures—a task that would be nearly impossible with only metrics and logs.
The Business Impact of Adopting Observability

Thinking about software observability as just another technical upgrade is a huge mistake. It's really a strategic business decision, one that pays off in tangible ways across the entire organization. While engineers get the immediate benefit of deeper system insight, the ripple effects are what truly matter: faster innovation, happier customers, and lower operational costs.
At its core, observability shifts your team's posture from reactive firefighting to proactive problem-solving. This isn't just a cultural win; it directly strengthens the bottom line.
The most immediate impact you'll feel is on your development teams. Suddenly, they can ship features faster and with far more confidence because they can actually see how their code behaves in the wild. This confidence doesn't just speed up one part of the process—it accelerates the entire development lifecycle, helping you respond to market changes and stay ahead of the competition.
Driving Innovation and Developer Efficiency
Once you have a mature observability practice in place, a powerful cycle begins. Your developers spend less of their time trying to reproduce obscure bugs and more of their time building things that create real value. They can spot performance regressions early and stamp them out before they snowball into major outages.
This means new features actually enhance the user experience instead of accidentally degrading it.
Observability is the bedrock of engineering excellence. When teams are not flying blind, they are empowered to experiment, iterate, and innovate safely. This reduces engineer burnout and makes the entire software delivery process more predictable and efficient.
This efficiency becomes even more critical in modern development pipelines. The insights you get from observability can be fed directly back into your CI/CD workflow, giving developers immediate feedback on their code changes. This approach pairs perfectly with established continuous integration best practices, creating a tight feedback loop that drives quality.
Enhancing Customer Experience and Protecting Revenue
In today's digital world, your user experience is your brand. A slow-loading page, a failed transaction, or a cryptic error message can send customers running to your competitors. Observability acts as a guardian for your customer experience, empowering your teams to find and fix issues long before most users even notice something is wrong.
Imagine an e-commerce platform during a massive sales event. The checkout process suddenly slows to a crawl. With distributed tracing, the team can instantly see the bottleneck is a third-party payment service. They resolve it in minutes, saving what could have been thousands in lost revenue. A potential crisis becomes a minor hiccup.
This focus on system health is why the data observability market—a key slice of the bigger picture—is growing so fast. Valued at $2.53 billion, it's on track to hit $2.94 billion within a year. This explosive growth shows just how vital it is for businesses to build and maintain systems that users can trust.
Reducing Operational Costs and Optimizing Resources
Finally, a solid observability strategy is a direct path to cutting operational costs. The biggest savings come from slashing the Mean Time to Resolution (MTTR). When your engineers can diagnose the root cause of a problem in minutes instead of hours (or even days), the cost of downtime plummets.
But it doesn't stop there. Observability also shines a light on how you're using your resources. Teams can finally spot over-provisioned services, optimize sluggish database queries, and make data-driven decisions about their infrastructure. This stops you from wasting money on cloud resources and ensures every dollar you spend is actually delivering value.
Alright, let's get into the nitty-gritty. Talking about observability is one thing, but actually putting it into practice is where the real work begins. Moving from theory to a working system isn't about flipping a switch; it's a deliberate process. You need to generate the right data, pick the right tools, and, just as importantly, build a culture where development and ops teams are genuinely curious and work together.
The absolute first step is instrumentation. Think of it as wiring up your system with sensors. Your applications and infrastructure have to be set up to send out the rich telemetry data—metrics, logs, and traces—that observability is built on. This usually means adding some code to your services, often with standard libraries and agents built just for this.
Starting with Instrumentation
You can't analyze what you don't collect. Instrumentation is the art of making your system observable by teaching it to talk about what it's doing. The whole point is to produce high-quality telemetry that gives you a true picture of your application's health and performance.
You generally have two ways to tackle this:
- Auto-instrumentation: This is the fast track. You use agents that automatically figure out what frameworks and libraries you're using (like a web server or a database client) and start generating telemetry without you having to change a single line of code. It's a fantastic way to get broad visibility across your stack with very little effort.
- Manual instrumentation: This is where you get specific. Developers add code to capture custom business logic or critical events. For example, you might manually create a trace to measure a particularly complex algorithm's performance or log an event with a customer ID to make debugging specific issues a breeze.
Honestly, the best approach is a mix of both. Auto-instrumentation gives you the wide, sweeping view, while manual instrumentation provides the deep, business-specific context you need to solve those really tricky problems.
Choosing Your Observability Tooling Approach
Once your services are humming along and sending out telemetry, you need somewhere for all that data to go. A place to send it, store it, and make sense of it. The world of observability tooling is massive, but it really boils down to two main camps: open-source solutions and commercial platforms.
Deciding between them comes down to your team's budget, in-house expertise, and what you prioritize. There’s no single right answer, just what’s right for you.
Choosing Your Observability Tooling Approach
| Factor | Open-Source (e.g., Prometheus, Grafana, Jaeger) | Commercial (e.g., Datadog, New Relic, Splunk) |
|---|---|---|
| Cost | Free to use, but you pay in engineering time for setup, maintenance, and scaling. | Subscription-based, often priced per-host or by data volume. Higher upfront cost. |
| Flexibility | Highly customizable and extensible. You have full control over the stack. | More opinionated, but offers a polished, integrated user experience out-of-the-box. |
| Maintenance | Your team is responsible for all updates, security, and operational overhead. | The vendor manages the platform, freeing your team to focus on using the data. |
| Support | Relies on community support through forums, documentation, and chat channels. | Comes with dedicated enterprise support, service-level agreements (SLAs), and training. |
Startups often lean toward open-source tools like Prometheus, Grafana, and Jaeger to keep initial costs low. Larger companies, on the other hand, frequently go for commercial options like Datadog, New Relic, or Splunk because they value the dedicated support and reduced operational headache. This demand for integrated solutions is a huge market driver, with these platforms making up 62% of the data observability market share. You can discover more about the growing need for real-time monitoring solutions and see just how big this space has become.
Integrating Observability into Your CI/CD Pipeline
Here's where things get really interesting. One of the most powerful things you can do is "shift left" with observability by baking it directly into your CI/CD pipeline. Suddenly, it’s not just a tool for fighting fires in production; it becomes a proactive quality check that catches problems before they ever see the light of day.
By analyzing telemetry data during automated testing, you can automatically detect performance regressions, memory leaks, or increased error rates introduced by a new code change. This creates an incredibly powerful feedback loop for developers.
This practice, sometimes called CI insights, gives engineers almost instant feedback on their code's health, often within minutes of a commit. Instead of finding out about a problem from an angry customer or a late-night alert, a developer can see that their change just added 50ms to a key database query and fix it before the pull request even gets merged.
Of course, building a system like this requires a solid foundation in automation. If you want to dive deeper into creating these kinds of efficient workflows, you should check out this expert guide to CI/CD best practices, which lays out key strategies for building development pipelines that are both robust and effective.
Ultimately, this integration is about making quality everyone's job and stamping out bugs at the earliest—and cheapest—possible moment.
Observability in Action with Real-World Examples

Theory is one thing, but software observability really clicks when you see it solve real, high-stakes problems. The data itself isn't the prize. The real value is in the stories that data helps you uncover—stories that show how deep system insight directly protects revenue, bolsters security, and drives smarter business decisions.
It's time to move past the abstract definitions and dive into tangible scenarios where observability wasn't just helpful; it was absolutely essential. Each of these examples reveals a different side of the practice, from frantic incident response to proactive product strategy, proving the immense impact of being able to ask any question of your system and get a clear answer back.
Preventing Revenue Loss for an E-commerce Giant
Picture this: it’s the biggest online sales day of the year. An e-commerce leader notices a disturbing trend—cart abandonment rates are creeping up, and checkout completion times are spiking. Traditional monitoring alerts are firing, screaming about high CPU on a few servers, but that's just noise. It tells them what is happening, but gives them zero clue as to why. With every minute that ticks by, millions in potential revenue are evaporating.
This is where distributed tracing steps in as the hero. By pulling up traces for slow and failed checkout requests, engineers instantly get a complete, end-to-end picture of the user's journey. The visual data makes the root cause painfully obvious: a third-party shipping calculator service, buckling under the traffic, is taking over 10 seconds to respond. That single, sluggish external call is creating a massive bottleneck, triggering a domino effect of timeouts across the entire checkout flow.
Armed with this precise information, the team makes a quick call. They temporarily disable the real-time shipping feature and switch to a flat-rate backup option. Within minutes, checkout times snap back to normal and cart abandonment rates plummet. Observability didn't just find a generic problem; it pinpointed the exact point of failure and gave the team the confidence to take decisive action, saving a fortune in lost sales.
The ability to instantly trace a single user request across dozens of microservices is a superpower. It turns a chaotic, high-pressure "war room" scenario into a focused, data-driven investigation that resolves issues in minutes, not hours.
Thwarting a Real-Time Fraud Attempt at a Fintech Company
Now, let's shift gears to a fintech platform that handles thousands of transactions every second. Here, security is everything. One afternoon, the on-call engineer gets an alert for an unusual spike in failed login attempts, but the pattern is strange. It’s not a brute-force attack hammering a single account; it's a slow, distributed attempt spread across thousands of them.
By correlating metrics with structured logs, the team quickly pieces together the context they need. The logs show the failed attempts are coming from a wide range of IP addresses, but they all share a peculiar user-agent string. Digging deeper, they see the requests are targeting accounts that have been dormant for more than a year. The story becomes clear: this is a sophisticated credential-stuffing attack, trying to identify and hijack inactive accounts while flying under the radar of simple alert thresholds.
Because their logs are structured with rich data like UserID, IPAddress, and UserAgent, the security team can write a quick query to isolate every single fraudulent request. They use this data to build and deploy a new firewall rule, blocking the attack pattern at the network edge. The entire incident, from detection to resolution, takes less than 30 minutes. Without the powerful combination of metrics and detailed logs, the attack could have gone undetected for days, risking serious financial and reputational damage.
Driving Product Strategy for a SaaS Provider
Observability isn't just for putting out fires; it's also a powerful tool for growth. A growing B2B SaaS company had just rolled out a highly anticipated new feature. But the initial adoption metrics were disappointingly low. The product team was left guessing. Are users not finding it? Is it confusing? Is it just buggy?
Instead of guessing, they turned to their observability platform, which was instrumented to capture user interactions as custom events and traces. Analyzing this data, they uncovered several key insights:
- A large number of users were clicking the button to try the new feature but were dropping off at the second step.
- Traces from these abandoned sessions showed high latency in a specific API call tied to the feature's setup process.
- User-facing error logs revealed a spike in non-critical "Configuration Mismatch" warnings. While these didn't break the app, they were clearly confusing people.
This data told a clear story. The feature was discoverable and people wanted it, but the user experience was broken due to a slow API and ambiguous instructions. With this knowledge, the engineering team optimized the slow endpoint while the UX team rewrote the in-app guidance. Two weeks later, feature adoption had tripled, directly boosting customer satisfaction and retention.
The Future of Observability and Emerging Trends
The world of observability never sits still. It can't. As our systems get more distributed and complex, the ways we understand them have to evolve, too. What's coming next isn't just about collecting more data; it's about getting smarter and more automated in how we turn that data into real, actionable answers.
Three big shifts are shaping this future, getting teams ready for what comes next in system intelligence.
First up is the tighter integration of artificial intelligence, a field often called AIOps (AI for IT Operations). This marks a fundamental move away from engineers manually digging through mountains of data. Instead of someone spending hours connecting dots between different telemetry streams, AIOps models can spot anomalies, correlate events across services, and even predict problems before they ever reach a user.
Imagine an AI-powered system that has learned the normal rhythm of your application. When it detects a hiccup, it doesn't just send a generic alert. It dives in, analyzes related logs and traces, and points you straight to the likely root cause. That’s not just a time-saver; it’s a game-changer for incident response.
The Rise of OpenTelemetry
Another huge development is the industry's embrace of OpenTelemetry (OTel). For years, if you wanted to collect telemetry, you were often stuck using a specific vendor's proprietary tools. This created a classic case of vendor lock-in, making it a nightmare to switch to a new platform without re-instrumenting your entire codebase.
OpenTelemetry is smashing that old model. It provides a single, open-source standard for how we instrument code and export our telemetry data—metrics, logs, and traces.
By separating the act of data collection from the tool that analyzes it, OpenTelemetry gives engineering teams true freedom. You can instrument your code once and point that data to any compatible platform you want, whether it's an open-source tool like Jaeger or a commercial vendor. No code changes needed.
This push toward a vendor-neutral standard is foundational. It ensures the focus stays where it should be: on getting value from your data, not getting tangled up in proprietary instrumentation.
The Convergence of Security and Observability
Finally, the line between observability and security is disappearing. This has given rise to a practice sometimes called "Securability," and it’s built on a simple truth: the same rich data that helps you debug a performance issue is also incredibly useful for spotting security threats.
With this approach, you start using your observability data to answer security questions:
- Anomaly Detection: Is that sudden spike in failed login attempts from a new country a bug or an attack? Your metrics and logs will tell you.
- Threat Hunting: Traces can show you if an attacker is making weird, unexpected calls between your internal microservices, potentially exploiting a vulnerability.
- Incident Response: When a breach does happen, detailed logs and traces become an immutable audit trail, showing you exactly what the attacker did and where they went.
This convergence means security is no longer a siloed team working in isolation. It becomes a built-in part of understanding your system's health, allowing you to find and fix threats using the very same data you already collect for observability.
Common Questions About Software Observability
As you start to wrap your head around software observability, a few common questions always seem to pop up. It's only natural. Let's tackle them head-on to clear up any confusion and make sure you're on the right track. Getting these fundamentals right is the key to building a strategy that actually works.
One of the first things people wonder is if they can get away with just one of the three pillars. It’s a tempting thought, especially when you're trying to keep costs and complexity down.
Can I Achieve Observability With Just Logs?
While logs give you incredibly rich, detailed information about specific events, they're only one piece of the puzzle. If you rely on logs alone, you're missing the high-level metrics that tell you when something is wrong in the first place. You also won't have the distributed traces to see how a single request travels through your entire system.
It's like having a detailed list of everything that happened in a city but no map and no sense of the overall traffic flow. You have tons of data, but no context.
True software observability comes from weaving all three pillars together—metrics, logs, and traces. When you correlate them, you get a complete, contextualized view of your system's behavior. Each pillar answers a different question, and their combined power is what turns raw data into actionable insight.
Is Observability Only for Microservices?
Nope. While observability is absolutely essential for navigating the complexity of microservices, its principles are valuable for any system, including monoliths. Every application, regardless of its architecture, can suffer from unexpected failures or those dreaded "unknown unknowns."
Implementing observability helps any engineering team debug issues faster, pinpoint performance bottlenecks, and ultimately build better, more reliable software. The instrumentation might look a little simpler in a monolith, but the core benefits of proactive problem-solving and deep system insight are universal. The goal is to understand your system's behavior, and that's a need every team shares.
How Is Observability Different From APM?
It's helpful to think of Application Performance Monitoring (APM) as a powerful subset of observability. Traditional APM is fantastic at tracking predefined metrics—the "known unknowns" like response times, error rates, and CPU usage. It's built to answer the questions you already knew you needed to ask.
Software observability, on the other hand, is a much broader capability. It empowers you to ask entirely new questions of your system on the fly, without needing to ship new code. It uses high-cardinality telemetry data to explore the "unknown unknowns"—those novel, perplexing issues that your APM tool wasn't configured to even look for. It’s the difference between monitoring a checklist and having a real conversation with your system.
Bringing this kind of insight into your development process is a game-changer, especially within your CI/CD pipeline. Mergify's CI Insights feature delivers observability directly into your continuous integration, using AI to spot and categorize infrastructure problems before they ever hit production. Learn how Mergify can help your team save time and reduce CI costs.