Pytest Print Stdout: Improve Debugging in Tests

Mastering Pytest's Stdout Capture System

Pytest offers a robust output capture system, a crucial tool for Python developers. This system provides valuable insights into your code's runtime behavior, significantly improving debugging and testing efficiency. By intelligently intercepting output streams, pytest offers a clear view of what's happening under the hood.
Whether you're using a simple print statement or managing more complex subprocesses, pytest can capture the output. This granular level of control helps pinpoint issues quickly and accurately, leading to faster debugging cycles and more reliable code.
Pytest achieves this by operating at the file descriptor level. This low-level approach allows it to intercept output from various sources, ensuring comprehensive capture capabilities. This distinguishes pytest from other testing frameworks, offering a superior debugging experience, especially when dealing with complex test scenarios and applications.
For those eager to enhance their coding skills, exploring fun coding projects can provide invaluable hands-on experience. Practical application reinforces understanding of concepts like output handling and debugging techniques. Working on diverse projects also exposes developers to various situations where output capturing becomes essential.
Understanding Pytest's Capture Mechanism
Pytest’s capture mechanism gives developers deep visibility into their code's behavior during testing. The ability to capture and display stdout and stderr output is essential for effective debugging and testing. By default, pytest captures output at the file descriptor level.
This approach allows pytest to intercept writes from simple print statements, as well as more complex scenarios like subprocesses. This is particularly helpful for identifying the root cause of failing tests, as the captured output can provide valuable context within the test report. More details on pytest’s output capturing can be found here.
This capability extends beyond simple print statements to include scenarios involving subprocesses and logging. This comprehensive approach ensures that you can monitor and analyze output regardless of the complexity of your testing environment. For instance, in tests involving external API calls, pytest will capture the responses, providing essential information for debugging potential integration problems.
Understanding this mechanism empowers developers to identify and resolve issues more effectively. They can use this information to pinpoint the exact location of a failure and understand the events leading up to it. This allows for the development of more robust and reliable code, minimizing the risk of future problems. Mastering pytest’s stdout capture allows developers to go beyond simply writing tests and build truly dependable software.
Customizing Pytest Stdout: Configuration That Matters
Controlling output in your testing environment is essential for efficient debugging and streamlined workflows. Pytest, the popular Python testing framework, offers robust configuration options for managing stdout (standard output), providing flexibility and control over how test results are displayed. Let's explore these options and see how they can improve your testing process.
Command-Line Control Over Output
Pytest provides handy command-line flags for direct stdout capture management. The --capture=no flag, often shortened to -s, disables output capturing entirely. This allows output from your tests, including print statements, to appear in your console immediately. This is invaluable for debugging, allowing you to observe the flow of your tests and quickly identify issues.
The --capture=sys option, on the other hand, captures output at the system level. This is useful when working with subprocesses or external libraries that write directly to stdout. This comprehensive capture ensures a complete view of your application's output during testing. The choice between -s and --capture=sys depends on your project's needs and the type of output you're handling.
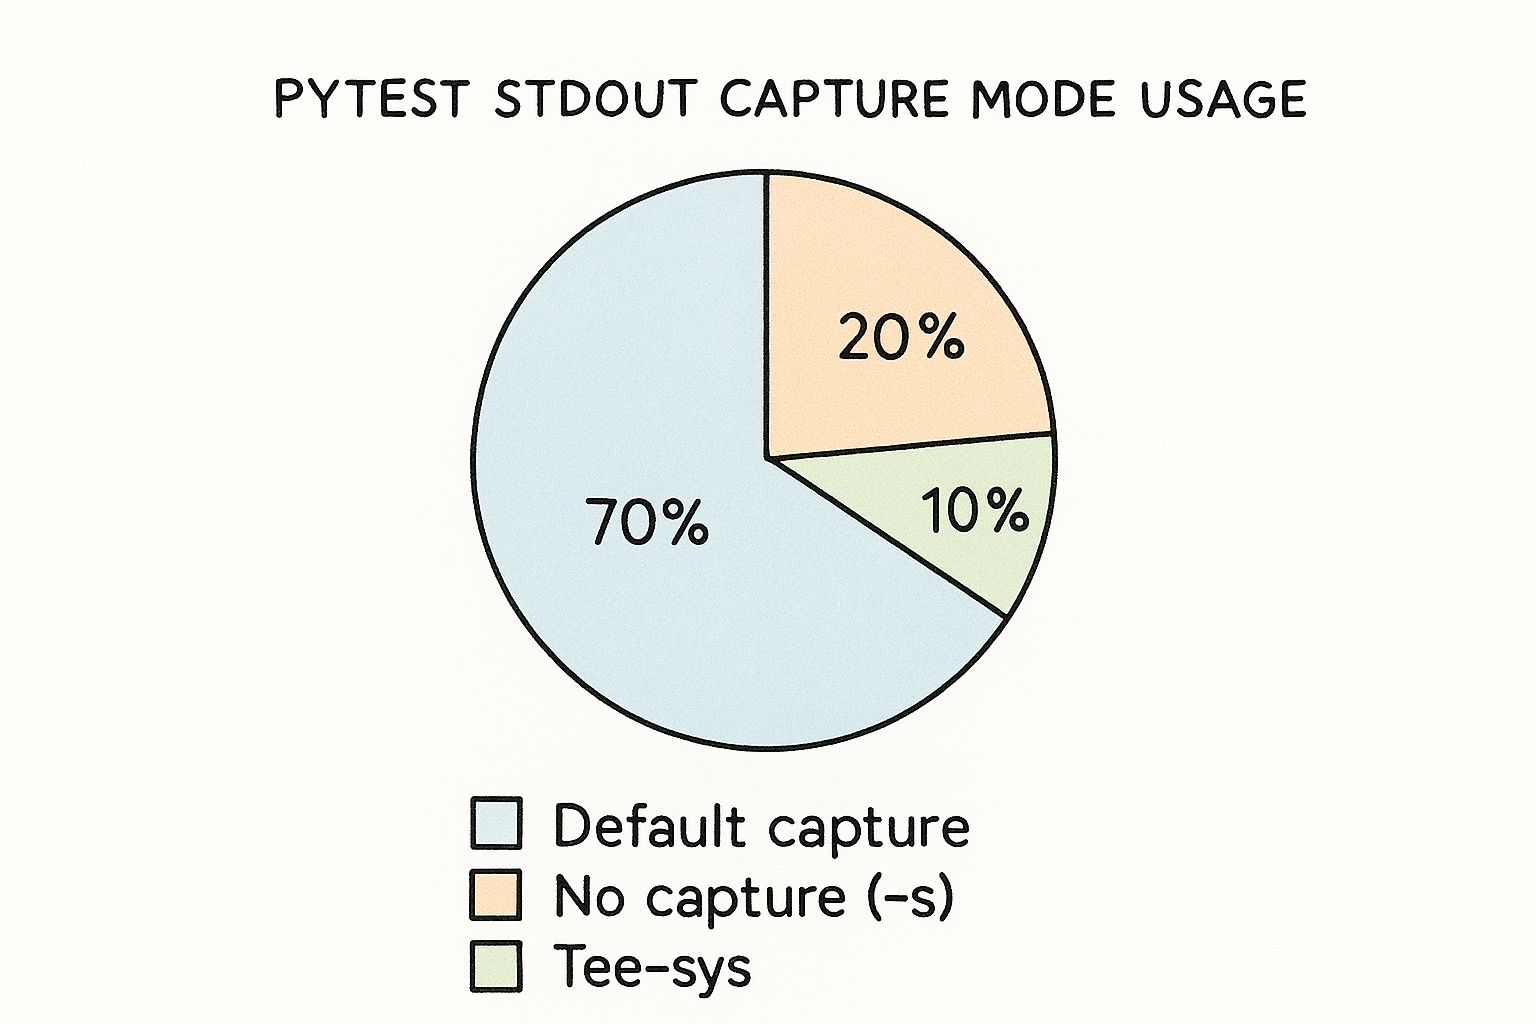
This pie chart illustrates the usage patterns of different pytest stdout capture modes. The default capture mode accounts for 70% of usage, highlighting its prevalence in typical testing scenarios. The no capture (-s) and tee-sys modes account for 20% and 10%, respectively, demonstrating their importance in specific debugging and system-level testing situations.
Centralized Configuration with pytest.ini
For more consistent control across projects, configure stdout capture behavior in your pytest.ini file. This file serves as a central hub for your Pytest settings. By specifying your preferred capture mode in pytest.ini, you ensure consistent output handling across different testing environments and among team members. This promotes collaboration and prevents discrepancies in test results.
This centralized approach is particularly beneficial for large projects with multiple contributors. Defining capture=no in your pytest.ini ensures all developers see real-time output during test execution. Setting capture=sys might be more appropriate for integration testing, where capturing output from external systems is crucial.
Advanced Output Handling
Pytest's stdout and stderr capturing capabilities extend beyond simple print statements. It handles more complex scenarios, such as subprocesses and logging. When running tests involving subprocesses, Pytest can capture their output and display it in the test report. This is particularly useful for integration or system testing involving external processes. Learn more about this at pytest-with-eric.com.
Understanding Pytest's output capture mechanisms gives developers fine-grained control over their testing environment, enabling more effective debugging and leading to more robust and reliable code. Mastering these configurations allows you to adapt to various testing scenarios and gain valuable insights from your tests.
To further illustrate the different capture options, let's take a look at a comparison table:
Pytest Stdout Capture Configuration Options: A comparison of different pytest capture modes and their use cases
| Capture Mode | Command | Behavior | Best Used For |
|---|---|---|---|
| default | (none) | Captures stdout and stderr, displaying them only on test failure. | General testing, keeping output concise. |
| no | -s or --capture=no |
Disables capture, allowing output to stream directly to the console. | Debugging, observing real-time test output. |
| sys | --capture=sys |
Captures output at the system level, including subprocesses. | Integration testing, capturing output from external systems. |
This table summarizes the key differences between the capture modes, highlighting their respective use cases. Choosing the appropriate mode allows you to tailor your testing environment to your specific needs, whether it's debugging with real-time output or capturing system-level output during integration tests. By leveraging these options effectively, you can gain deeper insights into your code's behavior and improve the overall quality of your testing process.
Leveraging Stdout in Sophisticated Test Scenarios

Building on the basics of Pytest's output capture, we can create truly robust tests for even the most complex situations. This means moving beyond simply observing output and actually using it for verification. This approach transforms Pytest from a simple testing framework into a powerful engine for verifying application behavior and how different parts of your system communicate.
Introducing The capsys and capfd Fixtures
Pytest offers specialized fixtures, capsys and capfd, specifically for interacting with captured output. These fixtures provide developers with programmatic access to both stdout and stderr within their test functions.
capsys allows you to capture output from print statements directly within your test, enabling assertions against this captured content. capfd gives you access to file descriptor-level output, capturing writes even from subprocesses or more intricate logging setups.
These fixtures provide a gateway to advanced verification techniques, leading to significantly more comprehensive tests. Using capsys, capturing output from print statements and making assertions on specific strings becomes straightforward. capfd extends this capability, capturing output from various system-level streams.
Advanced Output Analysis Techniques
This precise control over output unlocks the potential for much deeper analysis and verification. Regular expressions become an invaluable tool when applied to captured output. This lets you validate intricate patterns, ensuring your application formats and presents data exactly as expected.
Imagine verifying date formats, the structure of log messages, or even confirming the existence of specific error messages – all within your automated tests.
Furthermore, being able to distinguish between stdout and stderr becomes essential when testing your application's error handling capabilities. By capturing and analyzing stderr specifically, you can ensure your application reports errors correctly and provides useful diagnostic information. This is crucial for building truly robust and reliable test suites.
Real-World Examples
Let's illustrate the practical use of capsys with a simple example. Imagine testing a function designed to print a greeting:
def greet(name): print(f"Hello, {name}!")
def test_greeting(capsys): greet("World") captured = capsys.readouterr() assert captured.out == "Hello, World!\n"
This test elegantly uses capsys to capture the output from the greet function and confirms that the captured output matches the expected greeting.
Now, let's go beyond basic string matching. Consider a scenario where you need to verify the format of a log message using regular expressions with capfd:
import re import sys
def log_error(message): print(f"ERROR: {message}", file=sys.stderr)
def test_error_log_format(capfd): log_error("Something went wrong") captured = capfd.readouterr() assert re.match(r"ERROR: .+\n", captured.err)
By implementing these kinds of output verification techniques, development teams can catch regressions early, preventing them from reaching production. This ultimately transforms your test suite into a robust safety net, safeguarding application behavior and communication integrity. Through these strategies, you're creating tests that go beyond simply checking functionality – they ensure predictable and correct application output. This focus on precise behavior verification leads to more reliable and maintainable code.
Transforming Test Reports with Pytest-Print
Pytest's built-in standard output capture is a powerful tool. However, sometimes you need more control over the information in your test reports. That’s where pytest-print comes in. This plugin improves reporting by adding detailed insights directly into the test execution flow. This turns vague test failures into clear, actionable feedback.
Enhancing Output with Contextual Information
Imagine a complex test with multiple steps. A simple failure message might not show which step caused the problem. Pytest-print lets you insert print statements at crucial points in your test. This gives context that clarifies exactly where things went wrong, drastically reducing debugging time, especially in complex scenarios.
For example, instead of a generic AssertionError, you might see "Step 1: Success", "Step 2: Failure - Incorrect Value", "Step 3: Skipped". This detail helps pinpoint the error's source without manual debugging. This is more efficient than sifting through logs or using breakpoints.
Introducing Time Stamps and Prefixes
Pytest-print refines reports by adding time stamps to each print statement. This reveals execution bottlenecks within your tests. This information is invaluable for optimizing test performance, especially in large test suites where small delays add up. You can identify slow code sections that might otherwise be missed.
Organizing output with prefixes adds another layer of clarity. Prefixes like "DEBUG:", "INFO:", or "WARNING:" help categorize information in your test reports. This makes it easy to filter information and focus on relevant details during analysis. For instance, searching for "WARNING:" highlights potential issues quickly.
Structuring Output for Maximum Clarity
Pytest-print also creates hierarchical output structures. This clearly shows the execution path within nested tests or functions. By adding indentation or markers to your print statements, you create a visual representation of the test's flow. This makes it easier to trace the steps leading to a failure, especially with complex, multi-layered test setups.
The pytest framework is always evolving. Plugins like pytest-print, which allow printing additional information to the test report, show this evolution. This is helpful for reporting on sub-steps in long tests, or providing debug information when direct debugging isn't possible. With the --print-relative-time flag, pytest-print displays the time taken to reach specific print statements, providing insight into execution times. Learn more about pytest-print here.
Through these techniques, pytest-print transforms test reports into comprehensive debugging tools. Developers can understand and address issues efficiently. This improved workflow leads to better team collaboration and faster resolution of testing challenges. The added detail helps teams react quickly to errors and ensure software quality.
Decoding Test Failures Through Captured Output
Analyzing test output is crucial for effective debugging. Pytest's ability to capture stdout (standard output) offers developers valuable insights into the execution flow and helps pinpoint the root causes of failures. By examining output patterns, contextual clues, and execution traces, you can significantly improve your troubleshooting process. Let's explore how to extract meaningful information from pytest's captured output.
Isolating Relevant Information From Verbose Output
Test failures often generate a large amount of output, making it challenging to isolate critical information. While pytest’s output capturing helps by centralizing all relevant information, it can still be overwhelming. Learning to filter and focus on the key parts of the output is a vital skill.
One effective method is using the -s flag (or --capture=no) when running pytest. This disables pytest's default capture mechanism and prints all output directly to the console. This is particularly helpful for real-time debugging when you need to see the output immediately.
Another useful technique involves adding prefixes to your print statements. Categorizing messages with prefixes such as "DEBUG," "INFO," or "WARNING" allows you to quickly locate specific information within the output. This helps you focus on areas of interest without sifting through unnecessary messages.
Identifying Root Causes From Error Patterns
Specific output patterns often point to particular types of errors. For instance, a TypeError with a message about unsupported operand types might suggest a mismatch between expected and actual data types. Recognizing these patterns can significantly speed up the diagnostic process. The following table illustrates some common patterns:
To help clarify common error patterns in pytest output, let's examine a table summarizing likely causes and recommended actions:
Common Stdout Patterns in Failed Tests: Identifying and interpreting common output patterns that indicate specific types of test failures
| Output Pattern | Likely Cause | Recommended Action |
|---|---|---|
AttributeError: 'NoneType' object has no attribute '...' |
Variable is unexpectedly None |
Check for null values, review logic for unintended null assignments |
TypeError: unsupported operand type(s) for +: 'int' and 'str' |
Incorrect data types in operation | Ensure data types match expectations, use type casting if necessary |
IndexError: list index out of range |
Attempting to access an invalid index | Verify loop boundaries, double-check list/array sizes |
FileNotFoundError: [Errno 2] No such file or directory: '...' |
File path is incorrect | Double-check file paths, verify file existence |
As this table demonstrates, understanding the connection between output patterns and common error types can significantly streamline debugging. By recognizing these patterns, you can quickly diagnose and address issues.
Configuring Pytest for Richer Context
Pytest offers options for configuring the captured output to provide more context surrounding failures. By default, output is only displayed for failing tests. However, the --show-capture=all command-line option displays captured output regardless of the test's outcome.
This option provides a comprehensive view of the execution flow, even for passing tests. In larger test suites, this increased visibility can be incredibly valuable for tracking down intermittent or difficult-to-reproduce problems. This proactive approach can uncover hidden issues or unexpected behavior even in seemingly successful tests.
By capturing and analyzing output in your pytest tests, you gain valuable insights into how your code behaves. This powerful debugging technique allows you to go beyond simple pass/fail results and build more robust software. Combining this with strategies for isolating relevant information, recognizing patterns, and enriching the context around failures dramatically shortens the time it takes to resolve issues.
Scaling Stdout Capture for Enterprise Test Suites

As your test suite grows to encompass thousands of tests, managing the output from pytest print stdout becomes a significant challenge. Overwhelming output can clog your CI system and obscure vital information. Therefore, effective output management is essential for maintaining clear visibility and optimal performance. Examining the developer logs can be invaluable in identifying patterns and potential issues as you scale your pytest stdout capture.
Selective Capture Strategies
One effective approach is selective capture. Instead of capturing everything, focus on the most critical areas of your application. Concentrate on modules or components where failures are most likely or have the biggest impact.
This targeted approach reduces the amount of captured data while providing valuable insights where they matter most. For example, you could configure pytest to only capture output for tests related to core features or new code.
Filtering Techniques for Essential Information
Even with selective capture, you might still have a lot of output. Output filtering helps refine the information captured by pytest print stdout. Filtering by keywords, regular expressions, or log levels allows you to retain essential diagnostic information while discarding irrelevant noise.
For instance, filter out routine log messages but keep warnings, errors, and critical information related to test failures. This streamlines the output and makes debugging much faster.
Managing Parallel Test Execution Output
Parallel execution speeds up testing but can create challenges with output interleaving. Output from different tests can mix, making it hard to track individual test progress and pinpoint errors. Isolating output from parallel tests is crucial for maintaining clarity.
A common solution is assigning unique prefixes to each parallel test process's output. These prefixes could include test names, process IDs, or other identifiers. This separates output streams, simplifying analysis. Specialized test runners or reporting tools like Allure Framework can also help aggregate and organize parallel test output.
Balancing Debugging Needs and Performance
Balancing the need for comprehensive debugging information with performance is a constant challenge. Capturing and storing large amounts of output can impact test execution time and resource usage. Output buffering is a helpful technique where output is stored in memory and only written to disk if a test fails.
Consider setting thresholds for captured output. When the buffer reaches a certain size, older data can be truncated. This preserves the most recent output, which is often the most relevant for debugging failures. This balanced approach ensures efficient testing while providing enough information for effective debugging.
Building Custom Output Inspection Workflows
Beyond simply capturing and displaying output, pytest offers the ability to craft sophisticated testing workflows. These workflows utilize captured output to provide a more nuanced understanding of your application's behavior. This elevates your test suite from simple pass/fail results into a powerful analytical tool.
Automating Output Analysis for Deeper Insights
Many advanced teams develop custom fixtures and utilities to analyze stdout patterns across multiple test runs. This practice allows for the identification of subtle regressions and performance shifts that might otherwise be missed. For example, imagine a seemingly minor code change inadvertently adds extra whitespace to the output of a critical function. By analyzing stdout, a custom fixture can flag this unexpected change, alerting developers to a potential problem before it affects users.
A practical example could be a fixture that tracks the average length of log messages from a particular module. A sudden significant increase or decrease in this average could signal a change in logging behavior, potentially indicating a bug or performance regression. This proactive analysis helps maintain consistent behavior and identifies regressions early in the development.
Extracting Performance Metrics From Standard Output
Captured output can be a valuable source of performance data, going beyond mere correctness checks. By implementing automated output analysis, you can extract key performance metrics directly from standard output. This allows for monitoring performance trends and pinpointing areas for optimization.
Consider tests involving large datasets. By parsing timing information from stdout, you could automatically track processing time for each test and identify significant performance fluctuations. This automated performance monitoring helps maintain optimal application responsiveness.
Integrating With Monitoring Systems
Integrating output analysis with existing monitoring systems elevates this concept further. Feeding extracted metrics from stdout into monitoring dashboards establishes continuous quality validation throughout development. This transforms raw output data into actionable insights for quality improvements.
For instance, if your test suite includes integration tests interacting with a database, capturing and analyzing database query performance metrics from stdout allows for integration with a monitoring system. This enables continuous tracking of database performance and proactive identification of potential bottlenecks.
Practical Implementation Examples
Let's look at a simple example of extracting timing information from test output:
import pytest import re
def test_performance(capsys): # ... some code that generates timed output ... captured = capsys.readouterr() match = re.search(r"Execution time: (\d+)ms", captured.out) if match: execution_time = int(match.group(1)) assert execution_time < 1000 # Example assertion
This example demonstrates using regular expressions to extract specific values from captured output. These values can be used for assertions or integrated into monitoring systems. Building on this basic concept allows you to create complex workflows that transform raw output into valuable data for continuous improvement, turning your test suite into a powerful analytical tool that provides insights beyond simple pass/fail outcomes.
Boost your team's merge efficiency and reduce CI costs with Mergify. Streamline your code integration process and empower your developers to focus on building exceptional software.