A Guide to Flawless Playwright E2E Testing

Playwright offers a modern, unified framework for automating tests across Chromium, Firefox, and WebKit with a single API. Its architecture is built from the ground up to deliver faster and more reliable tests by directly tackling the common pain points that plague older tools, like flakiness and slow execution.
Why Modern Teams Choose Playwright for E2E Testing
Development teams are always on the hunt for tools that boost velocity without compromising on quality. While legacy frameworks like Selenium paved the way for automated testing, they often come with a lot of baggage—think slow execution, brittle tests, and complicated setups. Playwright was designed specifically to solve these problems, making it an incredibly compelling choice for today's software development cycles.
A huge reason for its rapid adoption is its unique approach to browser automation. Instead of relying on external drivers like Selenium, Playwright communicates directly with the browser engines. This direct line of communication strips away a lot of overhead and potential points of failure, which naturally leads to more stable and significantly faster test runs.
Speed and Reliability by Design
Flaky tests are a notorious productivity killer. We've all been there. Playwright confronts this issue head-on with its brilliant auto-waiting mechanism. It intelligently waits for elements to be truly ready for interaction—visible, stable, and not covered by another element—before it tries to perform an action. This completely removes the need for manual sleeps or those arbitrary waits that so often cause tests to fail for no good reason.
In fact, it's been reported that by automatically handling these readiness checks, Playwright can reduce test flakiness by as much as 60%. This means developers get to spend less time chasing down phantom failures and more time actually building features.
Another game-changer is the use of browser contexts. Each test runs in a completely isolated, incognito-like session. This simple but powerful feature ensures that cookies, local storage, and active sessions from one test can't possibly bleed over and interfere with another. The result is dependable and repeatable outcomes, every single time.
This chart really puts the performance difference into perspective, showing just how much faster Playwright is compared to other popular frameworks.
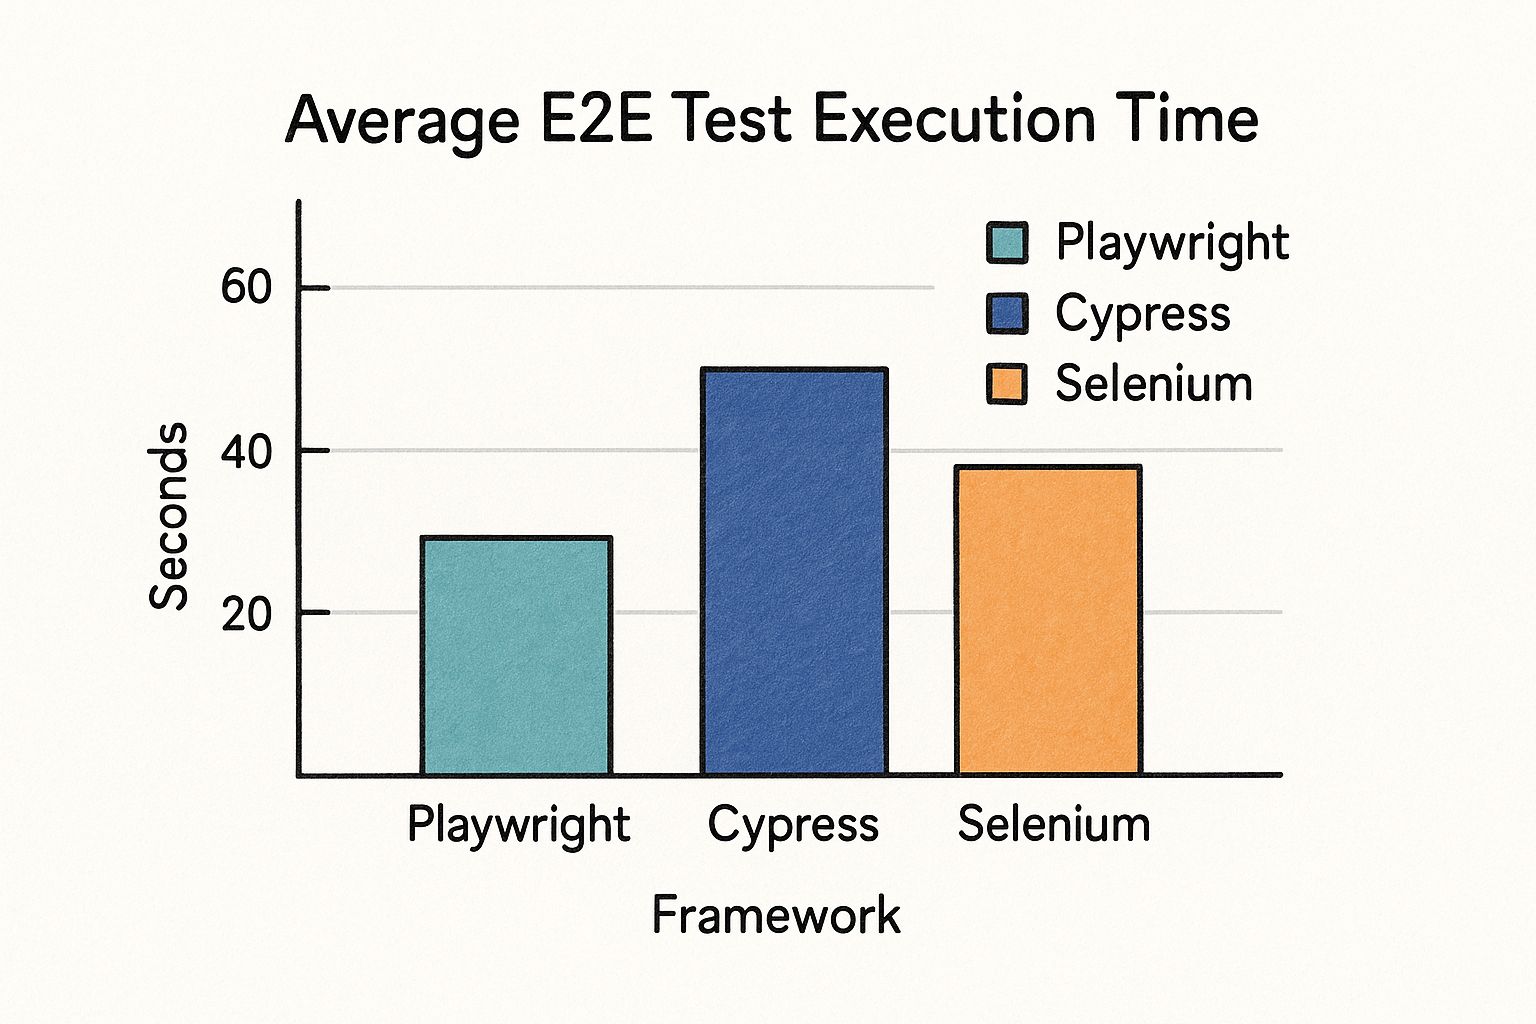
The data doesn't lie. Playwright's speed advantage is clear, allowing teams to get feedback from their test suites much, much faster.
The Shift in the Ecosystem
When you look at the landscape of testing tools, there's been a noticeable shift. For years, Cypress was a dominant force in the JavaScript testing world, largely thanks to its user-friendly developer experience. However, a turning point came in early 2024 when Playwright's download and usage numbers officially surpassed those of Cypress, signaling a real change in developer preference.
This trend isn't just happening with individual developers; it's also clear in enterprise adoption. More and more companies are finding that Playwright is better equipped to handle the demands of complex, large-scale applications. If you're curious, you can read more about why one such company made the switch from Cypress and the benefits they saw.
Playwright vs. Legacy Tools at a Glance
To make the differences even clearer, here's a quick side-by-side comparison of how Playwright stacks up against the more established tools.
| Feature | Playwright | Selenium | Cypress |
|---|---|---|---|
| Architecture | Direct WebSocket connection to browser engines | WebDriver protocol over HTTP | Runs in the same browser loop as the application, injecting test code |
| Cross-Browser | Full support for Chromium, Firefox, WebKit (Safari) | Supports most major browsers via separate drivers | Primarily Chromium-based; experimental support for Firefox/WebKit |
| Auto-Waiting | Built-in, intelligent auto-waits for actions and assertions | Requires explicit or implicit waits, often leading to manual configuration | Built-in, but can sometimes be less robust than Playwright's |
| Test Isolation | Uses isolated browser contexts for each test, ensuring no shared state | No built-in isolation; requires manual cleanup or complex setup | Test isolation is standard, but less sandboxed than Playwright's contexts |
| Parallel Execution | Strong, out-of-the-box support for parallel test execution across multiple workers | Possible but requires external tools and more complex configuration | Parallelization is available but often relies on a paid dashboard service |
As you can see, Playwright's modern architecture gives it a distinct advantage in key areas that directly impact developer productivity and test suite reliability.
Setting Up Your First Playwright Project
Alright, let's get our hands dirty. Moving from theory to a working test suite starts with scaffolding a solid project structure. I've seen too many test suites become a tangled mess simply because the initial setup was an afterthought. A proper foundation is what makes your playwright e2e testing efforts organized, configurable, and ready for your CI/CD pipeline down the road.
The whole journey kicks off right in your terminal. Just navigate to your project's root directory and run the one command that opens the door to the entire Playwright ecosystem:
npm init playwright@latest
This command fires up an interactive installer. It'll ask a few quick questions—like where to put your tests or if you want a GitHub Actions workflow out of the box. Honestly, for most new projects, just hitting enter and accepting the defaults is the perfect way to start. Once it’s done, Playwright creates a few key files for you, but the one you'll care about most is playwright.config.ts.
Decoding the Playwright Configuration
Think of playwright.config.ts as the brain of your testing operation. This is where you'll define global settings, tweak how browsers behave, and set up reports. Getting comfortable with this file is the key to making Playwright do exactly what you need it to.
Here are a few of the most critical options I always configure right away:
testDir: This tells Playwright where to find your test files. The default is./tests, which is a perfectly sensible convention. I usually stick with it.baseURL: This one is a game-changer. It lets you set a base URL for all your tests, so you can writepage.goto('/login')instead of hardcoding a full URL. It makes switching between your local, staging, and production environments a breeze.timeout: This sets the max time (in milliseconds) a test can run before it fails. The default of 30,000ms (30 seconds) is a pretty reasonable starting point, but you'll likely adjust it as your tests grow more complex.
These settings give you a solid baseline. But the real power comes when you start tailoring your setup for different environments. You can get a deeper sense of how these settings affect performance in this great guide to Playwright as an automation testing tool.
Pro Tip: Your local setup and your CI setup are two different beasts. Locally, you probably want to watch your tests run in headed mode. In CI, it's all about speed and efficiency, so you’ll always run headless. The config file makes it easy to define different project setups for both scenarios without any manual changes.
Environment-Specific Configurations
A professional testing setup anticipates running in different places. You shouldn't have to edit your config file every time you push code to your CI server. Playwright handles this beautifully with the projects array in the configuration.
For debugging and analysis, there are two settings I can't live without:
trace: This option captures an incredibly detailed trace of your test execution. My go-to setting here is'on-first-retry'. It's a best practice because it only generates a trace file if a test fails and gets retried, which saves a ton of disk space while making sure you have the debugging info exactly when you need it.video: Just like tracing, this records a video of the test run. And again,'on-first-retry'is the way to go. You get a perfect visual recording of what went wrong, but only for the tests that actually failed.
By getting a handle on these configurations, you build a flexible and powerful foundation for your playwright e2e testing suite—one that's ready for any environment you throw at it.
Crafting Reliable and Maintainable Tests
Once your project is set up, the real work begins. It’s not just about writing tests that pass; it's about writing tests that are effective, resilient, and easy for your team to understand and build upon.
A passing test is great, sure. But a test that’s readable, scalable, and doesn't shatter every time a developer tweaks a CSS class? That’s the gold standard. This is where a strategic approach to designing your playwright e2e testing suite makes all the difference.
The best tests are the ones that accurately mirror how a real person uses your application. It’s easy to just assert that a button exists on a page, but that doesn't tell you much. Instead, your tests should model complete user journeys from start to finish.
For an e-commerce site, this means simulating a user logging in, searching for a product, adding it to their cart, and landing on the checkout confirmation screen. This approach gives you so much more value because it validates entire business-critical workflows, not just isolated UI components. It's this focus on the big picture that makes automated testing such a powerful tool.
Building Resilient Locators
One of the biggest headaches with end-to-end testing is brittleness. A seemingly minor UI change, like renaming a data-testid or altering a class, can trigger a cascade of test failures. Playwright tackles this head-on with a locator strategy that prioritizes user-facing attributes over the nitty-gritty implementation details.
Instead of getting tangled up in fragile CSS selectors or complex XPath, you should always lean on locators that find elements the way a user would:
getByRole: This should be your first choice, always. It targets elements based on their ARIA role—thinkbutton,link, orheading. It’s incredibly resilient because it’s tied to accessibility and semantic HTML, things that tend to change far less often than styling hooks.getByText: Perfect for finding elements that contain specific, static text. Think buttons, labels, or navigation items.getByLabel: The go-to for form inputs. It finds an input element that’s associated with a specific text label, just like a user would.
By sticking to these user-centric locators, your tests immediately become more stable and descriptive. A test that readspage.getByRole('button', { name: 'Add to Cart' }).click()is crystal clear and far less likely to break than one using a selector likepage.locator('#product-123 > div.actions > button.primary').
Structuring Tests with the Page Object Model
As your test suite grows, you’ll quickly notice you're repeating the same selectors and actions across different tests. This is a recipe for a maintenance nightmare. The answer is the Page Object Model (POM), a time-tested design pattern that keeps your test code organized, reusable, and readable.
With POM, you create a dedicated class for each page or major component in your application. These classes are responsible for one thing: encapsulating all the locators and interaction methods for that specific piece of the UI.
For instance, a LoginPage class might contain:
- Locators for the username field, password field, and submit button.
- A single method, like
login(username, password), that handles filling out the form and clicking submit.
Your actual test file becomes much cleaner. You just create an instance of the LoginPage and call the login method. This abstraction separates your test logic from the UI's implementation details. If the login form ever changes, you only have to update the LoginPage class, not every single test that needs to log in.
The impact of high-quality automated testing is hard to overstate. The global test automation market was valued at $15.87 billion back in 2019 and is projected to skyrocket to nearly $49.9 billion by 2025. This massive growth is fueled by tools like Playwright that deliver faster execution and better reliability, making them indispensable for modern CI/CD pipelines. You can discover more insights about Playwright's market impact here.
Debugging Failed Tests Like a Pro
Let's be realistic: no matter how bulletproof you think your test suite is, failures are going to happen. It's a fact of life in development. A button ID changes, an API call is a little sluggish, or a new feature introduces some weird side effect you never saw coming.
The real test of a solid playwright e2e testing workflow isn't about avoiding failures. It's about how quickly and painlessly you can figure out what went wrong. This is where Playwright’s debugging tools shine, turning a frustrating chore into a focused investigation.
Your absolute best friend here is the Playwright Trace Viewer. When you enable tracing in your playwright.config.ts—and you really should, ideally with the 'on-first-retry' setting—Playwright captures a complete, interactive recording of any test that fails. Think of it as a time-traveling dev tool for your tests. You get to scrub through every single action, from clicks to text input, and see exactly what the browser was doing at that precise moment.
Mastering the Trace Viewer
The Trace Viewer isn't just a simple video replay. It's a full-blown diagnostic dashboard that hands you the entire context of the test run on a silver platter.
- Action Timeline: This gives you a step-by-step list of every command Playwright executed. Click on any action, and you'll instantly see the DOM snapshot right before and after it ran. It's incredibly powerful.
- DOM Snapshots: You can inspect a fully interactive snapshot of the Document Object Model at any point during the test. Jump in, use the familiar browser dev tools, and poke around to see what the page looked like.
- Console & Network Logs: See every console message and network request that occurred. This is a lifesaver for spotting those sneaky client-side JavaScript errors or failed API calls that caused the UI to fall apart.
This holistic view is a game-changer. Instead of just staring at a cryptic error message and guessing what happened, you have a rich, explorable recording of the failure. Your debugging time will plummet. It's also an amazing tool for hunting down and fixing flaky tests, a notoriously tricky problem you can read more about in our developer's guide to flaky test prevention.
Live Debugging Techniques
Sometimes, you just need to get your hands dirty and interact with the browser in real-time. For those moments, Playwright offers a few hands-on debugging commands.
Running your test with the --headed flag is a great start. It pops open a browser window so you can watch the test execute live. If things are moving too fast, combine it with --slowmo 500 to add a 500ms delay between each step. It's like watching your test in slow motion.
For ultimate control, drop await page.pause() directly into your test code. This simple line acts like a breakpoint. It halts the test and launches the Playwright Inspector, which gives you a powerful REPL (Read-Eval-Print Loop). You can experiment with different locators and commands against the live page until you find what works, then simply resume the test. It's the perfect interactive way to fix broken selectors and debug complex interactions on the fly.
Integrating Playwright into a CI/CD Pipeline
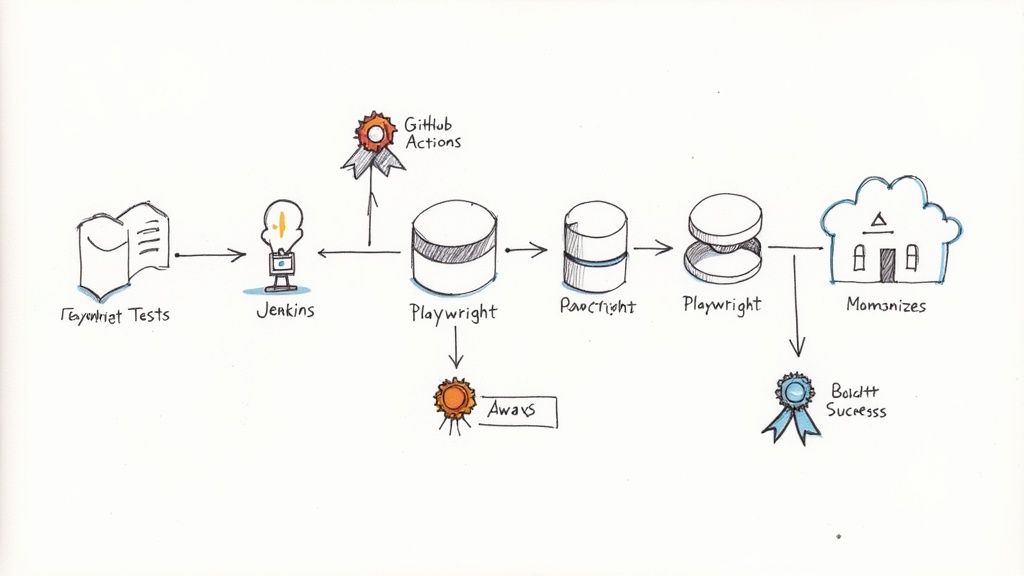
Writing solid tests on your local machine is a great start, but it's only half the battle. The real power of playwright e2e testing comes alive when you automate it, creating a safety net that runs on every single code push. Integrating Playwright into your CI/CD pipeline transforms it from a manual chore into an automated quality gate that works for you.
This process ensures that regressions don't sneak into your main branch. By catching bugs automatically before they're merged, you protect your application's stability and give your team the confidence to ship code faster and more frequently.
Let's walk through how to get this set up using GitHub Actions, a popular and powerful CI/CD platform.
Configuring the GitHub Actions Workflow
Setting up a workflow in GitHub Actions is refreshingly simple. All it takes is a single YAML file (something like .github/workflows/playwright.yml) that lays out the exact steps for your automated testing job.
For a robust Playwright pipeline, you’ll need a few core steps:
- Checkout Code: The first order of business is always getting the latest version of your code into the CI runner.
- Set Up Node.js: Specify the Node.js version your project needs to keep the environment consistent.
- Install Dependencies: A quick
npm installpulls in all your project's packages, including Playwright itself. - Install Playwright Browsers: This is a crucial one. The
npx playwright install --with-depscommand downloads the browser binaries (Chromium, Firefox, and WebKit) that your tests will actually run against. - Run Tests: Finally, kick off the test suite with
npx playwright test.
Here’s a pro tip: cache your dependencies and Playwright's browsers. Caching tells the CI runner to save these files after the first successful run. Every run after that will be significantly faster because it can just reuse the cached files instead of downloading everything all over again.
Optimizing for Speed and Feedback
A slow pipeline is a huge drag on any development team. To keep your feedback loop tight, you can enable parallel execution directly in your playwright.config.ts. Playwright was built from the ground up to run tests in parallel, which can drastically cut down your pipeline's total run time.
Just as important is making the test results easy to find and understand. The final step in your workflow should always be to publish the test artifacts.
This includes:
- The Playwright HTML Report, which gives a beautiful, comprehensive overview of the entire test run.
- Trace files for any failed tests, which allow developers to debug issues without ever having to re-run the pipeline locally.
These artifacts provide immediate, actionable feedback right inside the GitHub UI. This tight integration is a huge reason for Playwright's explosive growth. In fact, a recent survey found it's now used by 45.1% of automation testers, quickly surpassing older frameworks.
This rapid adoption is driven by modern features that go beyond just UI testing. If you're curious, our guide on using Playwright for API testing dives into just how versatile this tool can be. You can also read more about Playwright's rising popularity in the testing community.
Common Questions About Playwright E2E Testing
As teams start digging into Playwright E2E testing, or look to get more out of it, a few practical questions almost always bubble to the surface. Getting solid, real-world answers can help you sidestep common roadblocks and use the framework to its full potential.
Let's tackle some of the ones I hear most often.
How Does Playwright Handle Flaky Tests?
Flaky tests are the bane of any CI pipeline. One of Playwright's most-loved features is how it tackles this problem head-on. The magic is in its powerful auto-waiting mechanism.
Before Playwright tries to click, type, or do anything else, it automatically waits for the element to actually be ready. That means it checks if the element is visible, stable, enabled, and not covered by something else. This simple-sounding feature is a game-changer.
This built-in intelligence gets rid of the need for messy sleep() commands or arbitrary wait times, which are the root cause of so much flakiness in older frameworks. It smartly handles race conditions by making sure your app is ready for the next command, leading to far more dependable test runs.
By baking this resilience right into its core, Playwright just eliminates entire categories of common test failures. Your CI/CD pipeline stays green, and your team can stop chasing ghosts and start shipping features.
Can I Use Playwright for API Testing?
Absolutely. And you should. Playwright isn't just for clicking around a UI; it comes with a fantastic, first-class API testing library right out of the box. Using the request context, you can fire off HTTP requests to your backend without ever leaving your test files.
This is incredibly handy for real-world testing scenarios where you need to:
- Seed Data: Quickly create a test user, add products to a catalog, or set up any other data your UI test depends on.
- Manage State: Log a user in programmatically via an API call. This lets you skip the slow and repetitive UI login flow for every single test.
- Validate the Backend: After a UI action, you can make an API call to confirm the backend responded correctly or that the database was updated as expected.
This integrated approach means you can manage everything—UI and API tests—in a single, unified framework. It simplifies your toolchain and lets you build much richer, more robust end-to-end tests.
How Difficult Is Migrating from Cypress or Selenium?
Moving to Playwright from a framework like Cypress or Selenium is a question of scale. The effort really depends on the size and complexity of your existing test suite. While there's no magic "convert" button, the process is often less painful than you might think.
Playwright’s modern async/await syntax feels natural to anyone comfortable with JavaScript. The bulk of the work usually involves refactoring your old tests to use Playwright's more powerful locator strategies (like getByRole) and structuring the code with the Page Object Model (POM) to keep things clean and maintainable.
Most teams I've seen make the switch find the upfront investment pays for itself almost immediately. The massive gains in test speed, true cross-browser support, and overall reliability are long-term wins that make the migration well worth the effort.
Ready to stop wrestling with your CI pipeline and start shipping code faster? Mergify's Merge Queue and CI Insights features automate your pull requests, reduce flaky test failures, and provide the observability you need to fix infrastructure problems fast. Empower your team and streamline your workflow by visiting https://mergify.com.