Master Playwright Automated Testing

Playwright automated testing offers a fast, reliable, and genuinely modern way to handle end-to-end testing across every major browser. It was built to tackle the all-too-common frustrations of older frameworks by giving teams a single API, powerful tools, and fantastic performance. For today's fast-moving development teams, it's become a go-to choice.
Why Playwright Is Dominating Modern Testing
If you’ve been in the QA trenches for any length of time, you know the pain of flaky tests, sluggish execution, and the convoluted setups that come with older testing frameworks. These aren't just minor annoyances; they're genuine roadblocks that slow down development and erode trust in your test suite. Teams need something built for the speed of modern software delivery, and that’s exactly where Playwright comes in.
Microsoft engineered it from the ground up to solve these very problems. By operating directly at the browser engine level, it bypasses the architectural limitations of its predecessors, leading to interactions that are both faster and more stable. This is a game-changer for anyone serious about playwright automated testing.
The Shift Toward Speed and Reliability
It's not just talk; the developer community has noticed. Playwright's popularity has skyrocketed, making it a major player in test automation. In fact, recent data shows a clear shift in the market, with Playwright now leading the pack among automation professionals. According to the latest research on automation testing trends, its adoption rate has jumped to an impressive 45.1%, while established tools like Selenium have seen their market share decline.
This rapid adoption isn't just hype. It's fueled by real, tangible benefits that teams see every day. The chart below gives you a clear picture of the performance gap, comparing average test execution times.
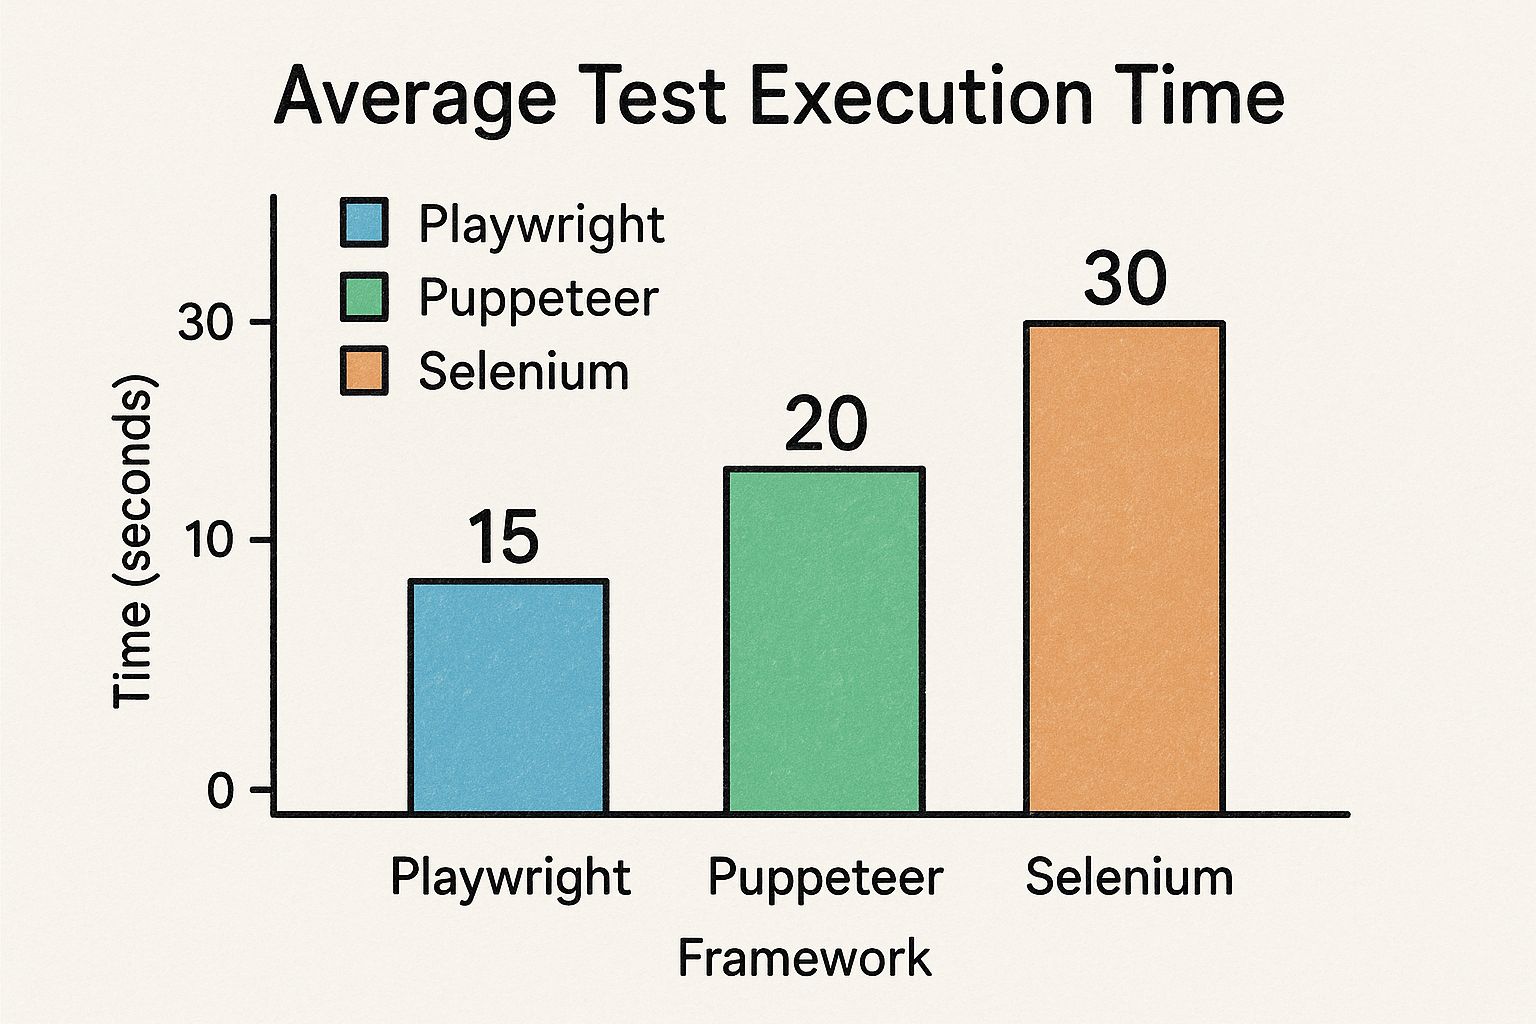
The numbers don't lie. Playwright's speed directly translates into faster feedback for developers and lower costs for your CI/CD pipeline.
To put this into perspective, let's look at how Playwright stacks up against older tools.
Playwright vs Traditional Tools A Quick Comparison
The table below breaks down some of the key differences you'll notice right away when moving from a traditional framework to Playwright. It highlights the modern features that make a real-world difference.
| Feature | Playwright | Traditional Frameworks (e.g., Selenium) |
|---|---|---|
| Architecture | Communicates directly with browser engines for speed and stability. | Relies on WebDriver protocol, which adds an extra layer and potential latency. |
| Auto-Waits | Built-in, intelligent waiting for elements to be ready. Greatly reduces flakiness. | Requires manual implementation of explicit or implicit waits, a common source of test failures. |
| Debugging Tools | Includes advanced tools like Trace Viewer and Codegen out of the box. | Debugging often relies on external tools or sifting through logs, which can be time-consuming. |
| Setup | Simple installation with a single command that includes browsers and drivers. | Often involves complex setup, requiring separate driver management for each browser. |
| Cross-Browser | A single, unified API works consistently across Chromium, Firefox, and WebKit. | Can have inconsistencies in behavior and API usage across different browsers and their drivers. |
As you can see, Playwright was designed to solve long-standing pain points, making the entire testing process smoother and more efficient.
Developer-First Features and Tooling
Beyond just raw speed, Playwright's success is rooted in its incredible developer experience. It comes packed with a suite of tools designed to make writing and debugging tests almost feel easy.
Playwright’s true strength lies in its built-in tooling. Features like Codegen, Trace Viewer, and auto-waits eliminate common sources of test flakiness and drastically reduce the time spent on debugging.
This developer-first philosophy is baked into its core features:
- Auto-Waits: Instead of peppering your code with manual
sleepsandwaitsthat cause instability, Playwright automatically waits for elements to be actionable before doing anything. This alone wipes out a huge category of flaky tests. - Trace Viewer: This is your secret weapon for debugging. It gives you a detailed, step-by-step recording of your test run, complete with DOM snapshots, console logs, and network requests for every single action.
- Codegen: A massive time-saver. It watches you interact with your browser and automatically generates clean, readable test code. It's the perfect way to get a huge head start when writing a new test.
Getting Your First Playwright Project Off the Ground
Diving into a new testing framework can sometimes feel like a chore, but Playwright makes the initial setup surprisingly painless. The goal isn't just to blindly run a command; it's to understand what that command does for you and how it sets you up for success.
Before we get started, just make sure you have a current version of Node.js installed. Since Playwright is a Node.js library, this is the only real prerequisite.
With that out of the way, you can fire up your terminal and kick off a new project with one simple, powerful command:
npm init playwright@latest
This isn't just a silent installer. It's an interactive guide that walks you through the setup, asking a few key questions. It'll ask if you prefer TypeScript or JavaScript, what you want to name your tests folder, and if you'd like to add a GitHub Actions workflow out of the box. For most new projects, just sticking with the defaults is a fantastic starting point.
What Just Got Created? Understanding the Project Structure
Once the installer finishes its magic, you'll see a few new files and directories in your project. This structure isn't random; it's a well-thought-out foundation designed to keep your playwright automated testing organized and ready to scale from day one.
Here’s a quick tour:
tests/: This is your home base. All your test files, which will end in.spec.tsor.spec.js, belong here. The installer even drops in anexample.spec.tsfile to give you a working example right away.playwright.config.ts(or.js): Think of this as the control center for your entire testing operation. It's where you'll tweak everything from which browsers to test against to how tests should behave when they run.tests-examples/: A handy little folder with more detailed examples that show off different Playwright features. Feel free to explore them for ideas or just delete the directory once you're comfortable.
This structured approach is more important than ever. The global test automation market, valued at $15.87 billion back in 2019, is on track to hit an incredible $49.9 billion by 2025. This explosion shows how deeply the industry is investing in quality and speed, a trend you can read more about in these test automation statistics.
A Few Key Configuration Tips
You'll get to know your playwright.config.ts file very well. A clean, smart configuration is the secret to writing tests that are easy to maintain. One of the first and most impactful changes I always recommend is setting a baseURL.
By defining abaseURLin your configuration, you can use relative paths likepage.goto('/login')instead of hardcoding full URLs in every single test. This small change makes your test suite massively easier to maintain and run against different environments, like a local server, a staging server, or production.
Here’s a practical look at what a basic, robust configuration might look like. This example sets you up to test against all three major browser engines right from the start:
import { defineConfig, devices } from '@playwright/test';
export default defineConfig({ testDir: './tests', fullyParallel: true, use: { baseURL: 'http://localhost:3000', trace: 'on-first-retry', }, projects: [ { name: 'chromium', use: { ...devices['Desktop Chrome'] } }, { name: 'firefox', use: { ...devices['Desktop Firefox'] } }, { name: 'webkit', use: { ...devices['Desktop Safari'] } }, ], }); With a setup like this, you're not just ready to write a test; you're ready for serious, cross-browser testing. You have a solid foundation to build on, ensuring your tests are organized, resilient, and prepared for whatever you decide to throw at them.
Writing Your First Meaningful E2E Test
Alright, with the project setup out of the way, it's time to get our hands dirty. Let's write a test that actually checks a valuable user journey. Forget the abstract "hello world" examples—we're jumping straight into a real-world e-commerce scenario: adding a product to a shopping cart. This approach is the best way to learn because it immediately introduces you to Playwright's most important concepts in a practical context.
Our goal is to move beyond just loading a page. We'll interact with a live demo site just like a real person would. We'll find a product, click to add it to the cart, and then—most importantly—verify it's actually there. This workflow covers navigation, element interaction, and the crucial final step of asserting that our actions had the intended effect.
Kicking Off Your Test with Codegen
One of the slickest ways to start a new test is with Playwright's Codegen tool. It’s a fantastic way to generate boilerplate code just by recording your actions in a browser. And trust me, this isn't just for beginners; it’s a massive productivity boost for seasoned engineers, too.
To fire it up, run this command in your terminal:
npx playwright codegen https://www.saucedemo.com/
This command does two things: it opens a new Chromium browser window and, alongside it, the Playwright Inspector. Now, just perform the user actions you want to test on the website:
- Type
standard_userinto the username field. - Type
secret_sauceinto the password field. - Click the "Login" button.
- Find the "Sauce Labs Backpack" and click its "Add to cart" button.
- Click the shopping cart icon in the top-right corner.
As you click around, you’ll see clean, readable test code appear in the Inspector window. This is your initial script, a perfect starting point that we can now polish into a robust, maintainable test.
Playwright's Codegen tool is your accelerator. It doesn't just write code; it teaches you by showing the exact locators and actions needed for each user interaction. Use it to get a fast draft, then polish it with best practices.
Once you’re done recording, copy the generated code and save it in a new file inside your tests directory. Let's call it shopping-cart.spec.ts. Now, we can make it our own.
Refining Code for Resilience and Clarity
The code from Codegen is a great start, but we can make it better. The golden rule for resilient tests is to avoid brittle selectors. Instead of relying on specific CSS classes or IDs that a developer might change on a whim, we should use user-facing locators that reflect how a real person finds elements on the page.
This is where Playwright really shines, with locators like getByRole, getByText, and getByLabel. These are far less likely to break when the underlying HTML structure gets refactored.
Here’s how we can refactor our recorded script to be more durable:
import { test, expect } from '@playwright/test';
test('should add an item to the shopping cart', async ({ page }) => { // Navigate and log in await page.goto('https://www.saucedemo.com/'); await page.getByPlaceholder('Username').fill('standard_user'); await page.getByPlaceholder('Password').fill('secret_sauce'); await page.getByRole('button', { name: 'Login' }).click();
// Add the backpack to the cart await page.locator('#add-to-cart-sauce-labs-backpack').click();
// Go to the cart await page.locator('.shopping_cart_link').click();
// Assert that the item is in the cart await expect(page.getByText('Sauce Labs Backpack')).toBeVisible(); });
Notice how we swapped a potentially fragile selector for the login button with getByRole. It’s a much more stable approach. Then comes the final, critical check: we use expect with getByText to confirm the product name is actually visible in the cart. This assertion is what turns a simple script into a genuine playwright automated testing check. Without it, the test wouldn't prove a thing.
Sure, here is the rewritten section, crafted to sound like an experienced human expert and match the provided examples.
Building Resilient Tests With Advanced Techniques
Writing your first test is one thing. Building a suite of tests that can actually withstand UI changes, flaky backend services, and evolving application logic? That’s a whole different ballgame. This is where you go from just using Playwright to truly mastering it. And here's the secret: advanced techniques aren't about writing ridiculously complex code. They're about smart, strategic test design.
A huge part of this is making your tests fast and, critically, independent. For instance, logging into your app before every single test is a massive time-sink and introduces an unnecessary point of failure. This is where Playwright’s storage state becomes one of your best friends. You can run the login flow just once, save the authentication state—like cookies and local storage—to a file, and then simply load that state for every subsequent test. It's a simple trick that completely bypasses the UI login and gets your tests straight to the point, which can dramatically slash your execution time.
Isolating the Frontend with Network Interception
Another incredibly powerful technique for building robust tests is network interception. Think about it: how do you test your application's behavior when an API call suddenly fails or returns some weird, unexpected error? You can't just wait around for the backend to be in that specific broken state. That’s just not practical.
Instead, you can tell Playwright to "catch" outgoing network requests and feed your application a mock response on the fly. This gives you complete control to simulate all sorts of backend scenarios:
- API Failures: Easily test how your UI handles a 500 server error without actually needing a broken backend.
- Empty States: Verify that your app correctly displays a "No data available" message when an API returns an empty array.
- Specific Data: Ensure your frontend can render edge-case data that would be a nightmare to set up in a live database.
This approach effectively decouples your frontend tests from backend dependencies. The result? Your tests become faster, far more reliable, and capable of covering states that are otherwise nearly impossible to reproduce consistently.
Organizing Your Code for Scale
As your test suite balloons from a handful of scripts to hundreds, organization becomes non-negotiable. Two patterns are absolutely essential for keeping a large-scale testing project sane: the Page Object Model (POM) and custom fixtures.
The Page Object Model is a classic design pattern where you create a class for each page or major component in your application. This class is responsible for one thing: holding all the locators and interaction methods for that specific piece of the UI. So instead of peppering page.getByRole('button').click() all over your test files, you’ll call a much cleaner, more descriptive method like productPage.addToCart(). This not only makes your tests more readable but also means that if a selector changes down the road, you only have to update it in one place.
Custom fixtures are a Playwright-specific superpower that lets you encapsulate setup and teardown logic. You can create fixtures to prepare test data, initialize a database state, or even log in a specific type of user before a test even starts. This keeps your actual test files lean and focused purely on the verification logic.
It's this combination of power and thoughtful organization that explains why Playwright’s adoption has exploded. Over 5,900 companies have woven it into their QA processes, from giants like American Airlines in the US to major players like Chubb in Switzerland. You can dig into the data about its global market share and see for yourself how its robust feature set meets the needs of diverse industries.
By combining storage state, network interception, and smart design patterns like POM, you're not just writing functional tests. You're building a truly resilient, scalable, and maintainable automated testing suite.
Getting Playwright into Your CI/CD Pipeline
Automated tests are great, but their real power is unlocked when they run automatically. Let's be honest, if you have to remember to run them manually, they'll eventually be forgotten. This is where a CI/CD pipeline comes in, turning your Playwright scripts from a chore into a reliable, automated safety net for your code.
By plugging Playwright automated testing into your development workflow, you ensure every single code change gets validated before it ever has a chance to reach your users. This catches bugs early, and we all know that's when they are cheapest and easiest to fix.
If you're new to the concept, this guide on what is a CI/CD pipeline is an excellent primer. For our purposes, we’ll use GitHub Actions. It’s one of the most common platforms out there and is refreshingly straightforward to set up.
Setting Up a GitHub Actions Workflow
The heart of any GitHub Actions pipeline is a simple YAML file. You just need to create a .github/workflows/ directory in your project and pop a file in there. This file is your instruction manual, defining the "when" and "how" of your test runs—for instance, triggering them on every push or pull request to your main branch.
Think of this workflow file as your recipe for success. It tells the CI runner exactly what to do, step-by-step, from checking out the code to installing all the browsers Playwright needs to work its magic.
Here’s a basic playwright.yml file to get you started:
name: Playwright Tests
on: push: branches: [ main, develop ] pull_request: branches: [ main, develop ]
jobs: test: runs-on: ubuntu-latest steps: - uses: actions/checkout@v4 - uses: actions/setup-node@v4 with: node-version: 18
  - name: Install dependencies
    run: npm ci

  - name: Install Playwright Browsers
    run: npx playwright install --with-deps

  - name: Run Playwright tests
    run: npx playwright test

  - name: Upload report
    uses: actions/upload-artifact@v4
    if: always()
    with:
      name: playwright-report
      path: playwright-report/
      retention-days: 30
With this in place, your test suite will automatically fire up on every pull request. You'll get immediate feedback posted right where you need it—in the PR itself.
Making Your Pipeline Runs Faster
That basic setup gets the job done, but we can make it a whole lot faster and more efficient. The browsers Playwright requires are pretty hefty, and downloading them from scratch on every single run is a massive waste of time and resources.
The solution? Caching.
Pro Tip: Always cache your Playwright browser binaries. By storing the downloaded browsers between runs, you can shave several minutes off your pipeline's execution time. Faster feedback for your developers is always a win.
Adding caching to your GitHub Actions workflow is surprisingly easy. The actions/cache step checks if the browsers are already stored from a previous run and, if so, restores them in a flash.
This one small tweak can have a huge impact on your team's velocity. Less waiting for test results means developers can iterate faster and merge their code with much more confidence.
Another key optimization is handling your test artifacts correctly. The final step in our example workflow, actions/upload-artifact, is absolutely crucial. It bundles up the Playwright HTML report, any screenshots, and video recordings—especially those from failed tests—and attaches them to the workflow run.
This means that when a test inevitably fails in the pipeline, you’re not left guessing. You can just download the report and see a full trace of the failure, turning a frustrating debugging session into a quick fix.
Common Questions About Playwright Testing
As teams start to get their hands dirty with Playwright, a few common questions and challenges almost always pop up. Getting ahead of these can really smooth out the adoption curve and help everyone get the most out of their playwright automated testing efforts.
Let's dive into some of the most frequent ones I hear.
One of the first things people ask is about performance. Is Playwright really as fast as everyone claims? The short answer is yes. Its modern architecture talks directly with browser engines, which lets it sidestep many of the bottlenecks you find in older tools. The result is faster, more reliable test runs.
Another big topic is test flakiness. How does Playwright help with those frustrating, random failures? Its secret weapon is the built-in auto-waiting mechanism. Playwright automatically waits for elements to be stable and ready for interaction, which just wipes out an entire category of flaky tests right from the start.
Handling Cross-Browser Nuances
A huge selling point for Playwright is its consistent API across Chromium, Firefox, and WebKit. But developers often wonder if they need to write special logic for each browser.
For the most part, you don't. The framework does a fantastic job of abstracting away most of the browser-specific quirks. That said, if you want a deep dive into creating truly robust tests that account for those tricky edge cases, check out our guide on automated testing best practices. It's packed with strategies that apply perfectly here.
The most effective approach is to run your entire test suite against all three browser engines in your CI/CD pipeline. This is the only foolproof way to catch browser-specific bugs before they escape into production.
Debugging Failed Tests Efficiently
So what happens when a test does fail? How can you figure out why—fast? Playwright’s built-in debugging tools are exceptional, and the Trace Viewer, in particular, is a total game-changer.
- What is the Trace Viewer? It’s a tool that captures a complete, step-by-step recording of your test run.
- What does it show? For every single action, you get a DOM snapshot, console logs, network requests, and a visual filmstrip of the test. It's like a black box for your tests.
- Why is it so useful? It lets you travel back in time to see exactly what the page looked like at the moment of failure, making debugging incredibly quick.
Instead of digging through endless logs, you get a rich, interactive report that pinpoints the exact cause of the problem. This slashes the time you spend fixing broken tests and keeps your team shipping.
Ready to stop wrestling with your CI pipeline and start shipping code faster? Mergify's Merge Queue and CI Insights eliminate flaky tests, slash CI costs, and give your developers back their time. See how it works at https://mergify.com.