Master OpenTelemetry CICD: Boost Your Pipeline Performance


Integrating OpenTelemetry into your CI/CD pipeline isn't just another box to check on your integration list. It’s a fundamental shift that turns your development process from a mysterious black box into a transparent, observable system. This gives you the deep visibility needed to track performance, diagnose failures, and ultimately, ship better software faster.
Why OpenTelemetry Is a Game-Changer for CI/CD

Let’s cut through the jargon and get straight to the point. Modern CI/CD pipelines are complicated beasts, stitched together with countless tools, stages, and environments. When a build fails or a test gets flaky, finding the root cause can feel like digging for a needle in a massive haystack of logs and notifications.
This is exactly the problem OpenTelemetry was built to solve. It’s not about collecting more logs or metrics; it’s about creating a unified, contextualized view of your entire software delivery lifecycle. By instrumenting your pipeline, you can trace a single commit from the moment it’s pushed, through every build step, test suite, and deployment stage.
Beyond Logs and Metrics
Traditional monitoring often leaves you with blind spots. You might have build logs from Jenkins, test results from Pytest, and deployment statuses from ArgoCD, but connecting them into a single, coherent story is a manual, soul-crushing effort. This fragmented view makes it nearly impossible to answer critical questions like:
- Why did this specific build suddenly take twice as long as the last one?
- Which specific test is making our entire test suite fail intermittently?
- How long does it really take for a code change to get from a developer's machine into production?
OpenTelemetry provides the framework to answer these questions with hard data. It standardizes how telemetry—traces, metrics, and logs—is generated and collected, creating a common language that all your tools can finally speak.
Key Takeaway: The real value of an opentelemetry cicd integration is transforming your pipeline from a series of disconnected events into a fully traceable, end-to-end process. This lets you debug faster, pinpoint bottlenecks, and make data-driven decisions to boost developer productivity.To understand how these pieces fit together, it helps to break down the core components and their roles in a CI/CD context.
Core OpenTelemetry Components for CI/CD
| Component | Role in CI/CD | Key Benefit |
|---|---|---|
| OpenTelemetry SDKs | Instrument build scripts, test runners, and deployment tools to generate telemetry data (traces, metrics, logs) at each stage. | Provides the raw, structured data needed to create a complete picture of the pipeline's execution. |
| OpenTelemetry Collector | Receives, processes, and exports telemetry data from various sources in the pipeline to your chosen observability backend. | Decouples data collection from your backend, allowing for flexible routing, filtering, and enrichment of data. |
| Traces | Link together operations across different pipeline stages (e.g., git push -> build -> test -> deploy) into a single, cohesive view. |
Allows you to visualize the entire lifecycle of a change and quickly identify which stage is causing delays or failures. |
| Metrics | Capture quantitative data, such as build duration, test success rates, and resource consumption (CPU/memory) for each job. | Helps you monitor performance trends, set SLOs for your pipeline, and identify resource-intensive tasks for optimization. |
| Logs | Add contextual information to traces and metrics, providing detailed error messages or output from specific build commands. | Enriches your observability data, making it easier to diagnose the root cause of a problem without sifting through raw log files. |
By combining these components, you get a powerful, multi-dimensional view of your pipeline's health and performance.
Gaining Widespread Industry Trust
The shift toward standardized observability isn't just some niche trend; it's rapidly becoming a core pillar of modern software engineering. The numbers speak for themselves. In a recent survey of 400 IT professionals, nearly half of organizations (48.5%) are already using OpenTelemetry, with another 25.3% planning to adopt it soon. That means over 73% of the industry is betting on OpenTelemetry for their observability needs.
This growing trust underscores its importance. By adopting OpenTelemetry, you’re not just keeping up—you're implementing robust CI/CD best practices that give your team a real competitive edge. It’s a strategic move that ensures as your systems grow in complexity, your ability to understand and manage them grows right along with them.
Preparing Your Pipeline for Instrumentation
Jumping into instrumentation without a clear plan is like setting sail without a map—you'll get somewhere, but probably not where you intended. A little upfront strategy is all it takes to make sure your OpenTelemetry CI/CD integration provides real insights from day one, rather than just a flood of noisy, low-value data.
Before you touch a single line of instrumentation code, the first thing to figure out is where your telemetry data will actually live. This is your observability backend—think Grafana, Datadog, or Honeycomb. Your choice here often comes down to what your team already uses, your budget, and what you’re trying to achieve.
With a backend selected, the next practical step is getting your credentials. You’ll need API keys and endpoint URLs to get your pipeline talking to your new tool. Treat these like gold. Store them in your CI/CD system’s secrets manager, never in your config files.
Charting Your Course with a Pipeline Map
Now for the real strategic work. Resist the urge to instrument everything all at once. Instead, start by drawing a high-level map of your entire CI/CD pipeline, from the moment a developer hits git push all the way to a final deployment.
This map is your secret weapon. It helps you and your team pinpoint the most painful, high-impact areas to focus on first. Get everyone together and ask some tough questions:
- Where are the bottlenecks? Are builds dragging on for an eternity?
- What is most fragile? Do flaky tests constantly derail your merges?
- Where is visibility lowest? Which parts of your deployment process are a total black box?
This simple exercise brings instant clarity. If slow builds are your number one headache, you know to start by instrumenting that stage to get detailed timings. If flaky tests are the bane of your existence, then tracing each test run will give you the most immediate bang for your buck.
Defining Your Key Performance Indicators
Your pipeline map naturally guides you toward defining your Key Performance Indicators (KPIs). These are the specific, measurable metrics that tell you whether your pipeline is healthy and efficient. Generic metrics are useless; tie them directly to your team’s real-world pain points.
By defining clear KPIs upfront, you transform raw telemetry into actionable signals. You're no longer just collecting data for the sake of it; you're gathering evidence to solve specific, high-impact problems within your development lifecycle.
Think about what really matters to your team. Here are a few examples of how to connect pain points to tangible KPIs:
| Pain Point | Relevant KPI | What It Tells You |
|---|---|---|
| Slow Builds | P95 Build Duration per Repo | The typical worst-case build time, helping you spot performance regressions. |
| Flaky Tests | Test Failure Rate by Branch | Identifies unstable branches or specific test suites that need attention. |
| Long Lead Times | Change Lead Time (from commit to deploy) | Measures the end-to-end velocity of your delivery process. |
When you focus on targeted metrics like these, the dashboards and alerts you build will directly address the issues slowing your team down.
Aligning with Development Best Practices
This kind of strategic preparation isn't just about tooling; it’s a shift in process. By mapping your pipeline and defining KPIs, you're embracing a more mature, data-driven approach to delivering software. This thinking aligns perfectly with what high-performing teams have been doing for years.
For a deeper dive into this philosophy, our guide on continuous integration best practices offers great context for building resilient, observable workflows.
This thoughtful planning ensures your OpenTelemetry CI/CD initiative gets off to a flying start. It helps you avoid the common pitfall of drowning in data and instead focuses your efforts on making meaningful improvements right away. With a clear plan in hand, you’re ready to get into the nuts and bolts of instrumentation.
Instrumenting Your Build and Test Stages
Alright, let's move past the theory and get our hands dirty. This is where the real value of an OpenTelemetry CI/CD integration comes to life. We're going to dive into the practical side of things: instrumenting the build and test stages of your pipeline. I'll show you how to wrap your existing commands to pull out the rich telemetry data that tells the full story of your software delivery process.
The image below gives you a great visual of how a telemetry trace flows through the pipeline, creating a single, observable path from the first build command all the way to deployment.
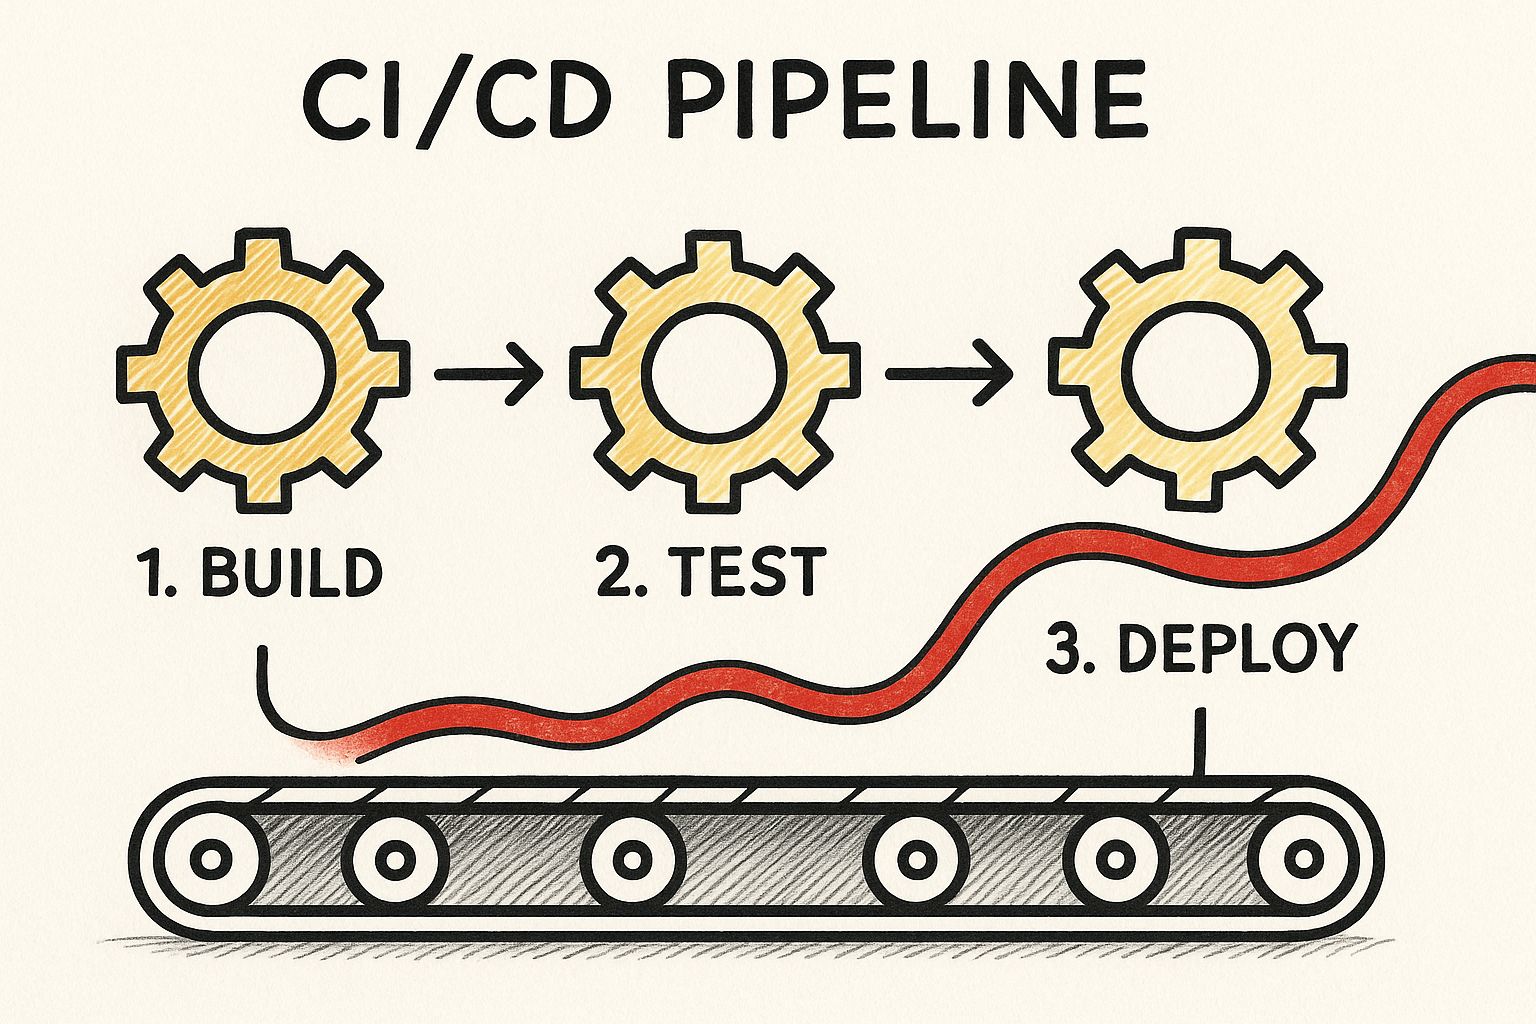
With the right instrumentation in place, you can stitch together all these separate stages into one coherent narrative. It's a game-changer.
The magic behind this unified view is often OpenTelemetry's auto-instrumentation libraries. These are powerful tools that automatically capture telemetry from common frameworks without forcing you to manually change your application or test code. This is a huge win—it drastically lowers the barrier to entry and gets you to valuable insights much faster.
Putting Auto-Instrumentation to Work in Your Pipeline
Auto-instrumentation is your express lane to pipeline observability. For compiled languages like Java, this usually means attaching a Java agent to your build or test command. If you're working with an interpreted language like Python, you'll typically wrap your execution command instead. The goal is identical: inject OpenTelemetry’s data-gathering magic directly into your running processes.
Let's take a typical CI workflow using GitHub Actions as an example. You can easily modify your existing steps to bring in OpenTelemetry.
For a Python project using pytest, your original test step is probably pretty simple:
- name: Run tests run: pytest To instrument this, you'll first install the necessary OpenTelemetry packages and then wrap the
pytestcommand withopentelemetry-instrument. The best part? Configuration for exporting the data is handled through environment variables, which keeps your commands clean and your concerns separated.
This simple change transforms a basic pass/fail signal into a rich stream of data. You'll get timings for individual tests, setup and teardown durations, and traces that can pinpoint the exact source of a failure.
A Practical Example in GitHub Actions
Let's walk through a more complete example. Say you want to trace your entire Python test suite and send that data over to an OpenTelemetry Collector.
First, you'd define your OpenTelemetry endpoint and service name as environment variables in your GitHub Actions workflow file. This is where you'll plug in the secrets you configured earlier.
env: OTEL_SERVICE_NAME: "my-app-ci-tests" OTEL_EXPORTER_OTLP_ENDPOINT: "http://otel-collector:4317" OTEL_EXPORTER_OTLP_INSECURE: "true" Next, your "Run tests" step gets a little more involved, but the payoff is massive.
- name: Run Instrumented Tests run: | pip install opentelemetry-distro opentelemetry-instrument opentelemetry-instrument pytest With just those few changes, every
pytestrun now generates incredibly detailed traces. If a test fails, you won't just see a red "X." You’ll get a distributed trace showing the entire execution flow that led to the failure, complete with logs and attributes. This is how you stop asking, "Did the build pass?" and start asking, "Why did this specific test suddenly take 500ms longer than usual?"
The Power of an Engaged Community
The rapid evolution of tools like auto-instrumentation is all thanks to an incredibly active open-source community. OpenTelemetry has become one of the fastest-growing projects within the Cloud Native Computing Foundation (CNCF), which says a lot about its importance in the cloud-native world.
The project’s momentum is driven by over 10,000 individuals and 1,200 companies. That growth is tangible; downloads for the Python OpenTelemetry library, for instance, shot up by 445% year-over-year. This vibrant community ensures the project is always evolving, adding support for new languages, frameworks, and use cases like CI/CD observability. You can dig into this impressive growth in the latest Grafana OpenTelemetry report.
By wrapping your existing build and test commands, you are not just adding monitoring. You are fundamentally changing how you debug and optimize your pipeline, enabling a shift from reactive problem-solving to proactive performance management.
This same approach isn't just for testing. The same principles apply directly to your build steps.
Instrumenting Build Scripts
From my experience, build processes are often a major source of slowdowns. By instrumenting them, you can finally break down what looks like a monolithic build job into a series of well-defined, measurable spans.
- Dependency Installation: How long does
npm installorpip installreally take? - Code Compilation: Is your Java or Go compilation step the real bottleneck?
- Container Image Builds: Pinpoint those slow layers in your Dockerfile.
Wrapping these commands lets you visualize each step's duration and resource usage. This data is gold for finding optimization opportunities, like improving your caching strategy or figuring out which build tasks can be run in parallel. The result is a faster, more efficient pipeline that gives your developers more time to do what they do best: build great software.
Using the OpenTelemetry Collector for Smart Data Routing
Sending telemetry data directly from your CI pipeline to an observability backend might seem like the simplest path. It's direct, for sure. But this approach quickly becomes a bottleneck, locking you into a single vendor and creating an inflexible, difficult-to-manage data flow. This is exactly where the OpenTelemetry Collector becomes your most valuable player.
Think of the Collector as a vendor-agnostic Swiss Army knife for your telemetry. It acts as a central, highly configurable hub that can receive data from anywhere, process it in powerful ways, and then forward it to one or more backends. This decoupling is the backbone of any serious opentelemetry cicd strategy.
Designing a Scalable Telemetry Architecture
When you decide to implement the Collector in a CI environment, you're faced with two main deployment models. Each has its own set of trade-offs, and the right choice really comes down to your team's scale and infrastructure.
- As a Container: Running the Collector as a service container within your CI job (like in GitHub Actions or GitLab CI) is the quickest way to get started. It's self-contained and co-located with your build, which makes the initial setup feel pretty straightforward. The downside? You spin up a new Collector for every single pipeline run, which can add overhead and makes centralized configuration more of a headache.
- As a Standalone Service: For larger setups, this is the way to go. Running the Collector as a persistent, standalone service on a dedicated virtual machine or Kubernetes cluster is far more efficient. All your CI jobs send their telemetry to this single, central Collector. This model drastically simplifies management, cuts down on redundant processing, and gives you a single point for data routing and policy enforcement.
For most teams, starting with the container model is perfectly fine. But as your observability practice matures, migrating to a standalone Collector is a natural and highly recommended evolution.
Practical Configuration for CI/CD
The real magic of the Collector happens in its configuration file, typically config.yaml. This file is where you define three key sections: receivers, processors, and exporters. For a CI/CD use case, you can craft a configuration that dramatically improves the quality of your data before it even leaves your environment.
A common pain point is noisy, low-value telemetry cluttering your backend and driving up costs. Processors are the answer. For instance, you can use the filter processor to drop health check spans or other repetitive data that offers little insight.
processors: filter: spans: exclude: match_type: strict attributes: - key: http.target value: /healthz
With this simple snippet, the Collector will discard any spans related to the /healthz endpoint, immediately reducing noise and cost.
The OpenTelemetry Collector transforms data collection from a rigid, one-way street into a dynamic, intelligent pipeline. It empowers you to clean, enrich, and route telemetry before it ever hits your backend, ensuring the data you store is high-quality and cost-effective.
Another powerful technique is data enrichment. Using the attributes processor, you can automatically add crucial CI/CD metadata to every single span that passes through.
Enriching Traces with Pipeline Context
Have you ever tried debugging a failed build without knowing the exact commit or branch it came from? It’s a frustrating experience. The resource processor lets you automatically add this context, making your traces infinitely more useful.
You can configure it to pull in environment variables passed down from your CI system, such as the commit SHA, branch name, or pull request number.
processors: resource: attributes: - key: ci.commit_id from_attribute: "env:GITHUB_SHA" action: upsert - key: ci.branch_name from_attribute: "env:GITHUB_REF_NAME" action: upsert
Now, every trace is stamped with its source. This allows you to instantly correlate pipeline performance with specific code changes—a massive leap in diagnostic capability.
Looking ahead, the role of the Collector is only set to expand as the project matures to meet new technological demands. The OpenTelemetry Collector is expected to hit its 1.0 stable release in 2025, a milestone that will simplify complex deployments even further. This evolution is particularly relevant for opentelemetry cicd as telemetry provides deeper insights into the performance of all system components, including emerging AI workloads within deployment cycles. You can learn more by exploring the latest OpenTelemetry trends for 2025. This progress solidifies the Collector's position as a critical piece of modern observability infrastructure.
Visualizing and Acting On Your CI/CD Telemetry

Collecting mountains of telemetry data is just the starting point. The real value from your OpenTelemetry CI/CD integration comes when you turn that raw data into clear, actionable intelligence. This is how you stop just monitoring your pipeline and start actively optimizing it.
It all begins by creating meaningful dashboards in your observability backend of choice, whether that's Grafana, Datadog, or something else. A good dashboard tells a story at a glance, highlighting the health and efficiency of your entire delivery process. Forget generic charts; focus on visualizations that answer the critical questions your team faces every single day.
Creating Powerful Pipeline Dashboards
The whole point of a dashboard is to get insights in seconds, not to drown in data. You should be able to spot trends, anomalies, and potential headaches almost instantly.
Based on my experience, here are a few high-impact charts that are non-negotiable for any team serious about CI/CD observability:
- P95 Build Times Per Repository: This is so much better than a simple average. It shows you the worst-case scenario for your builds, making it fantastic for catching performance regressions that might otherwise fly under the radar.
- Test Failure Rate by Branch: Is your
mainbranch stable while feature branches are constantly on fire? This chart makes it painfully obvious where the problematic code or flaky test suites are, so you know exactly where to focus your attention. - Deployment Frequency Over Time: As a core DORA metric, this tracks your team's throughput. Watching this trend line go up is a huge motivator and a clear sign that you’re improving efficiency.
Once you have your key visuals, the next step is to make this data work for you by setting up smart alerts.
From Reactive to Proactive with Smart Alerting
Dashboards are great for analysis, but you can't stare at them all day. Smart alerting is what lets your team respond to problems in real-time, often before they snowball and affect the wider development team. You can—and should—configure alerts for specific, critical events that demand immediate action.
For instance, you could set up an alert that triggers if the number of flaky tests suddenly jumps by more than 10% in a 24-hour period. Another essential one is for deployment duration; if a deployment to production takes 50% longer than its P90 baseline, you need to know about it right away.
By combining rich visualizations with intelligent alerting, you shift from a reactive "what broke?" mindset to a proactive "what can we improve?" culture. Your team stops firefighting and starts engineering a more resilient delivery process.
Debugging with Distributed Traces
When an alert does fire or a pipeline just plain fails, distributed traces are your ultimate debugging weapon. A trace gives you a complete, end-to-end view of a single pipeline execution, following the journey of a commit from the initial trigger all the way through every job and step.
Imagine a build failing with some cryptic error message. Instead of sifting through gigabytes of raw logs, you can just pull up the trace for that specific run. You’ll see a waterfall view showing the exact duration of each step, letting you follow the breadcrumbs from one job to the next. You can instantly pinpoint which step failed, examine its logs in context, and review any associated attributes, like the commit SHA or runner IP.
This kind of power turns what could be a multi-hour debugging nightmare into a five-minute investigation.
To help you get started, it's crucial to focus on the right metrics. Here’s a rundown of some of the most valuable data points you can gather with an instrumented opentelemetry cicd setup and why each one is so important for your team.
Key CI/CD Metrics to Track with OpenTelemetry
| Metric Name | What It Measures | Why It's Important |
|---|---|---|
| Change Lead Time | The time from a code commit to its successful deployment in production. | A core DORA metric that reflects the overall speed and efficiency of your entire delivery process. |
| Build Duration (P50/P95) | The median and 95th percentile time it takes for a build to complete. | Helps identify slow builds, track performance over time, and measure the impact of optimizations. |
| Test Success Rate | The percentage of test runs that pass without any failures. | A direct indicator of code quality and stability. A declining rate can signal issues with flaky tests or regressions. |
| Deployment Frequency | The number of deployments to production over a specific period. | Measures team throughput and the pace of value delivery to users. |
| Mean Time to Recovery | The average time it takes to restore service after a production failure. | A critical DORA metric that shows how quickly your team can respond to and resolve incidents. |
Tracking these key metrics provides a solid foundation for understanding your pipeline's health. As you get more comfortable, you can start digging deeper to uncover even more opportunities for improvement.
Common Questions About OpenTelemetry in CI/CD
When you're plugging a new technology straight into your core development pipeline, you're going to have questions. It's only natural. Integrating OpenTelemetry into a CI/CD workflow is no exception. Let's walk through some of the most common things engineers ask when they're getting started.
How Much Performance Overhead Will OpenTelemetry Add?
This is usually the first question on everyone's mind, and for good reason. No one wants to slow down their builds.
The short answer is: the overhead is typically minimal and highly manageable. OpenTelemetry SDKs are built to be lightweight and efficient right out of the box.
But the real impact comes down to your configuration. If you try to instrument every single function call and send each trace individually, you'll probably feel it. The trick is to be strategic. Use sampling to control the data volume and lean on the OpenTelemetry Collector to batch data before sending it off. This smart approach gives you the rich insights you need without bogging down your pipeline.
A well-configured OpenTelemetry setup in CI/CD is all about finding valuable signals, not creating a firehose of noise. You're making a small performance trade-off for a massive gain in visibility, and it's almost always worth it.
Can I Integrate OpenTelemetry with My Proprietary Tools?
Absolutely. This is actually one of OpenTelemetry's biggest strengths. It’s designed to be vendor-agnostic, breaking down the data silos that proprietary tools often create.
You generally have two ways to tackle this:
- Direct Instrumentation: If your proprietary tool lets you run custom scripts, you can wrap your build, test, and deploy commands with OpenTelemetry SDKs. This lets you generate telemetry right from your pipeline jobs.
- The Collector as a Bridge: Some tools use their own reporting methods, like webhooks. In this case, you can set up the OpenTelemetry Collector to catch that data, transform it into the standard OTLP format, and then forward it to your observability platform.
This flexibility means you can build a single, unified view of your entire pipeline, even if you're working with a complex mix of different tools.
Auto-Instrumentation vs. Manual Instrumentation: Which Is Better?
This isn't really an "either/or" choice. Think of it more as a "when to use which" situation.
Auto-instrumentation is your best friend for getting started quickly. It's fantastic for capturing broad, foundational telemetry from common frameworks and libraries in your build and test stages. You get a ton of value right away with very little effort.
Manual instrumentation is what you turn to when you need to dig deeper and add business-specific context. You'll want to use it for things like:
- Creating custom spans around critical business logic in your pipeline.
- Adding custom attributes to traces, like
customer_tierorfeature_flag_status. - Tracing operations that auto-instrumentation can't see, like calls to a legacy system.
A mature observability strategy uses both. Start with auto-instrumentation for wide coverage, then sprinkle in manual instrumentation wherever you need high-fidelity, contextual insights.
What’s the Best Practice for Handling Secrets?
Managing secrets—like the API keys for your observability backend—is something you have to get right. Leaking credentials in your telemetry data is a huge security risk.
The golden rule is to never embed secrets directly in your code or logs. All your credentials should live inside your CI/CD platform’s built-in secrets management system, like GitHub Actions Secrets or GitLab CI/CD variables.
On top of that, use the OpenTelemetry Collector’s processors to scrub sensitive data before it leaves your environment. You can configure processors to redact or completely remove specific attributes that might contain private information, such as Authorization headers or user emails. This gives you a strong, defense-in-depth security posture. For a broader look at securing your entire pipeline, check out these general CI/CD security best practices.
Ready to stop guessing and start seeing? Mergify's CI Insights gives you the observability you need to diagnose pipeline bottlenecks, identify flaky infrastructure, and cut down on CI costs. See how Mergify can transform your CI/CD workflow.