Master Engineering Performance Indicators for Team Success

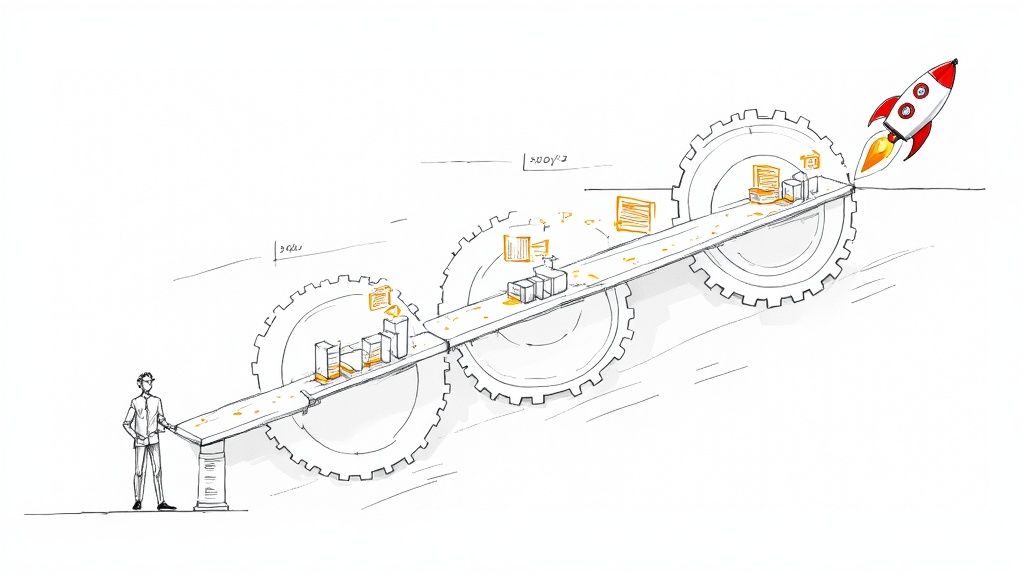
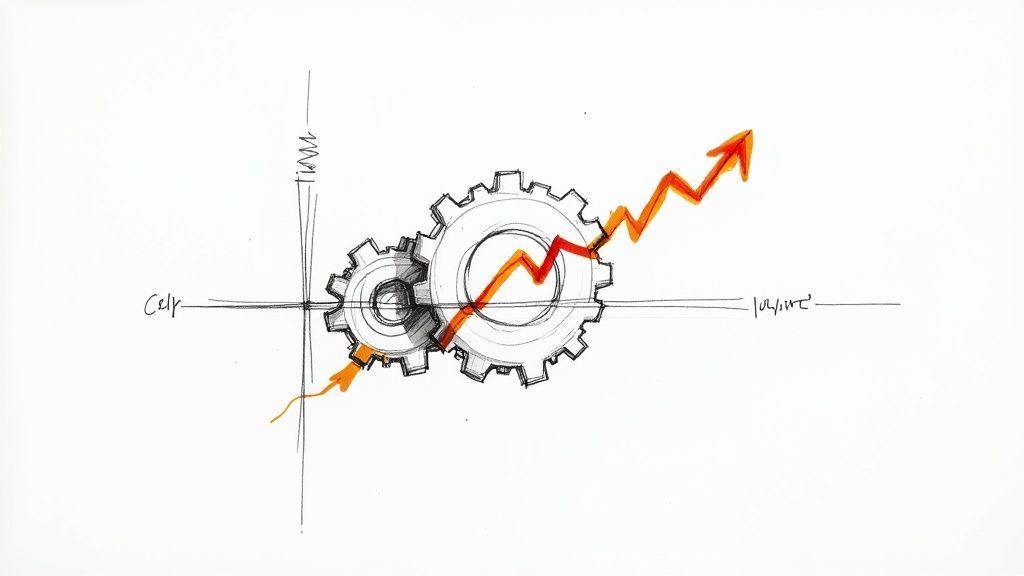
Engineering performance indicators are your team's command center, turning the chaos of daily development into clear, actionable data. Think of them as the dashboard in a race car; without those dials and readouts, you're just guessing how fast you're going, if the engine is healthy, or when you need to pit. They are absolutely essential for tying the code your team ships every day to the bigger business goals.
Why Engineering Performance Indicators Matter
Without a solid way to measure performance, engineering teams are left to operate on hunches and assumptions. It’s a recipe for disaster that often leads to blown deadlines, ballooning technical debt, and a frustrating disconnect between the engineering department and everyone else. Engineering performance indicators (EPIs) cut through the noise by providing objective data on your team's efficiency, quality, and real-world impact.
These metrics aren't about counting lines of code or closing tickets. That's old-school thinking. Instead, they focus on outcomes that reveal the true health and velocity of your entire development lifecycle. When you start tracking the right indicators, you create a powerful feedback loop that naturally drives continuous improvement.
Connecting Actions to Outcomes
The real magic of EPIs is their ability to connect the dots between the day-to-day grind and your company's strategic vision. When you get them right, they bring a new level of clarity to everyone, from the engineer writing the code to the CEO in the boardroom.
Here’s how they empower different people in your organization:
- For Engineers: They get a direct line of sight into how their work affects system stability and speed. This fosters a real sense of ownership and encourages them to find ways to improve the process from the ground up.
- For Managers: They have the hard data needed to spot bottlenecks, balance workloads, and coach their teams toward better performance—without resorting to micromanagement.
- For Leaders: They can finally translate technical operations into business-speak, which allows for much smarter decisions on resource allocation, project timelines, and strategic planning.
To really get the most out of these indicators, you have to start with a strong team. That includes having best practices for hiring remote software developers who are ready to thrive in a data-informed culture.
A metrics-driven culture isn't about surveillance; it's about creating a shared language for success. The whole point is to light up the path to improvement, not to point fingers when things go sideways. When teams see metrics as a tool for learning, they become empowered to solve problems before they even start.
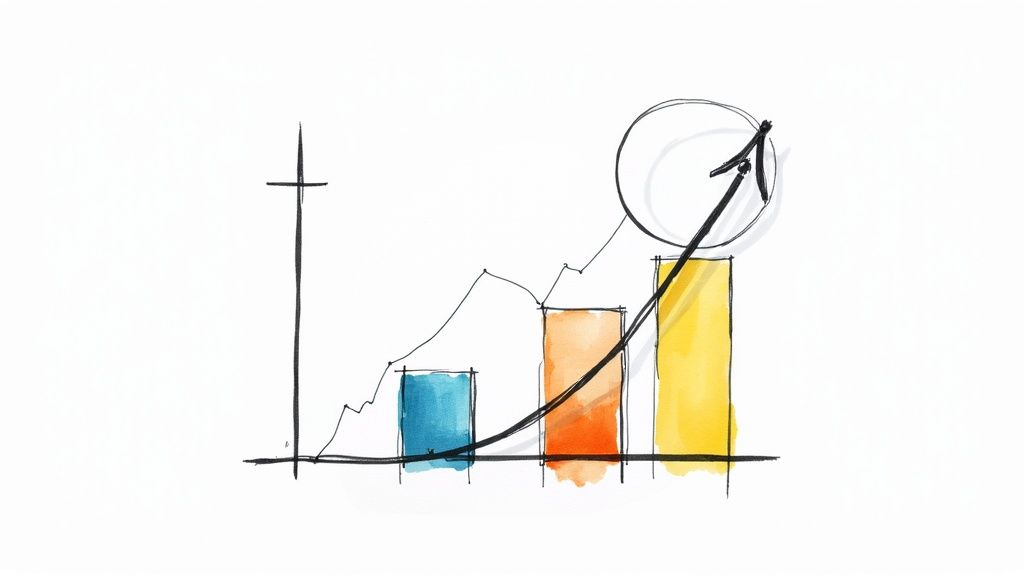
This data-first approach is more important than ever. The global engineering services market has been booming, with revenue growing at a compound annual rate of about 5.3% between 2015 and 2025. In a field this competitive, performance indicators are non-negotiable for keeping an eye on progress and adapting to market shifts.
The Four Pillars of Engineering Excellence
Chasing a single engineering metric is a losing game. If you focus only on speed, you'll inevitably ship rushed, buggy code. But if you obsess over quality, your delivery pipeline can slow to a crawl, frustrating both your team and your customers.
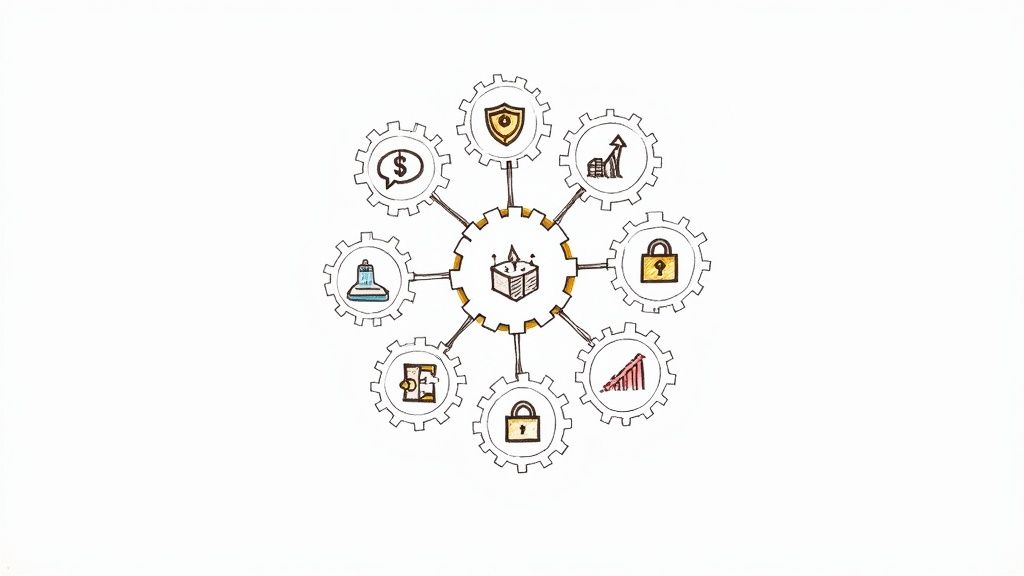
True engineering excellence isn’t about picking one over the other. It’s about finding a healthy balance, supported by four distinct but deeply connected pillars of performance.
Think of it like a chair—if one leg is shorter than the others, the whole thing wobbles. By understanding these pillars, you can build a holistic, stable view of your team's effectiveness, answering critical questions that go beyond just raw output.
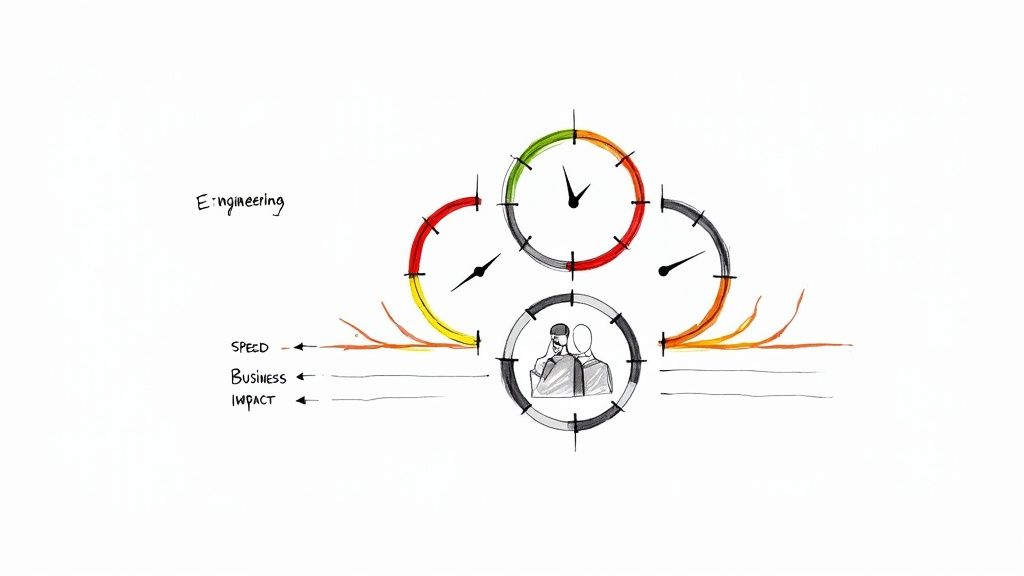
The visual below shows how three of these core concepts—speed, delivery, and reliability—work together.
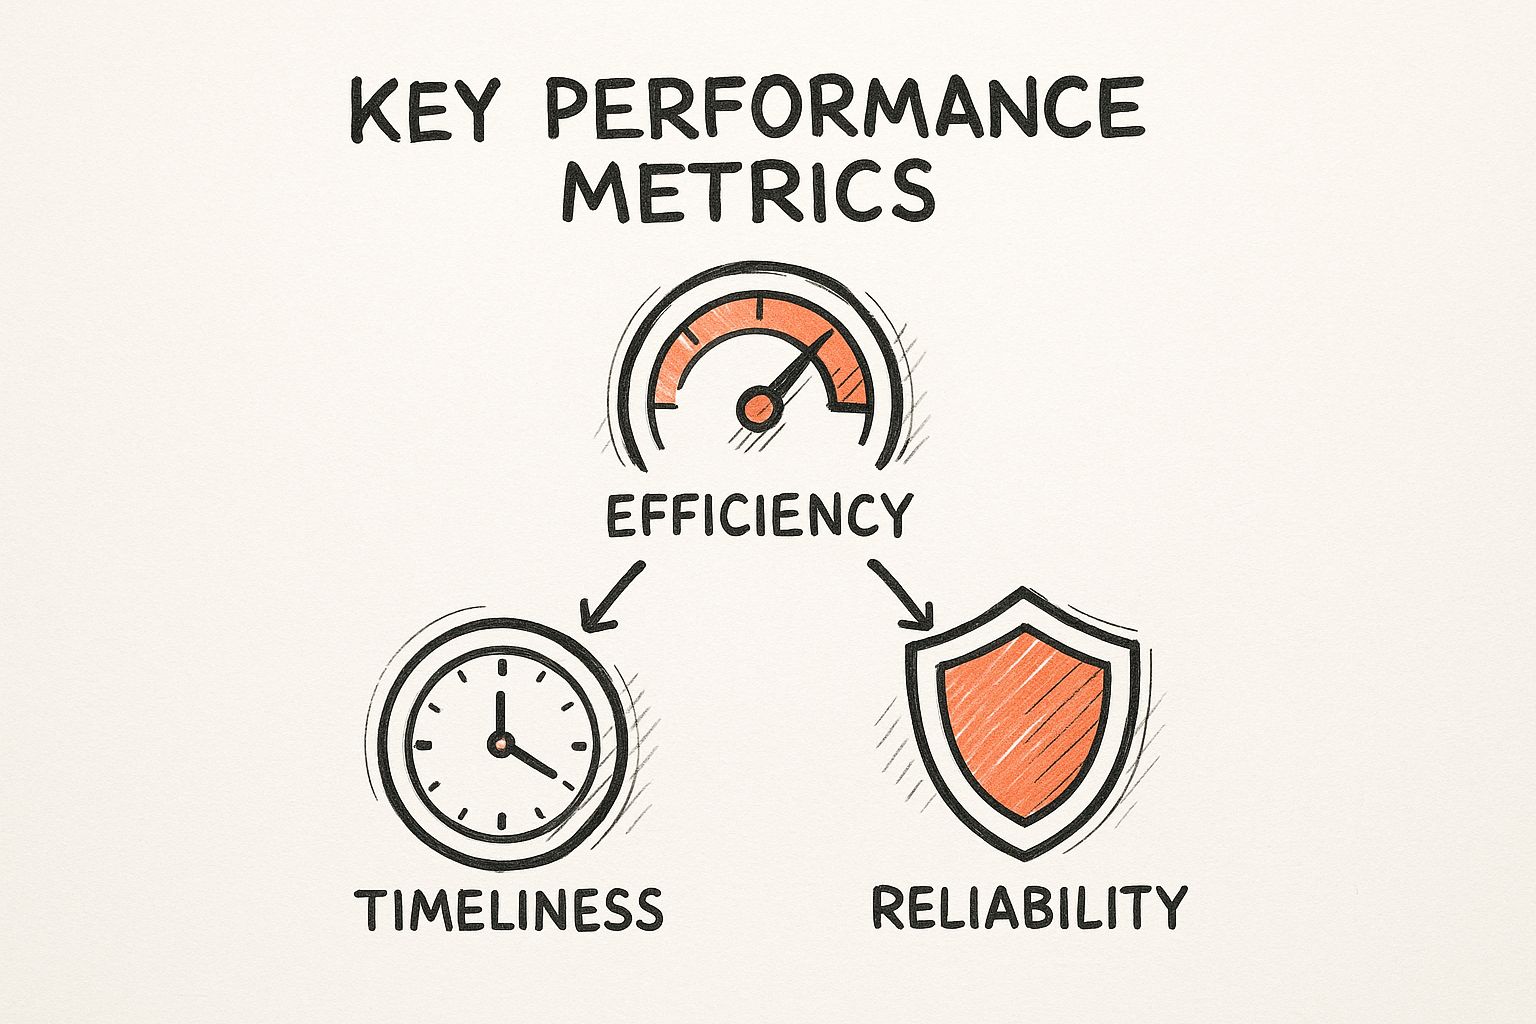
Elite performance happens when you can deliver value quickly and predictably without sacrificing the stability of your system. It's a symbiotic relationship.
These four pillars give you a complete picture of your team's health and effectiveness. Let's break down what each one measures and why it's so important.
The Four Pillars of Engineering Performance Indicators
| Pillar | What It Measures | Key Metrics Examples | Why It's Important |
|---|---|---|---|
| Speed & Throughput | The velocity of your development pipeline, from initial commit to production deployment. | Deployment Frequency, Lead Time for Changes. | Reveals your team's agility and ability to respond quickly to market needs and customer feedback. |
| Quality & Stability | The reliability and robustness of the code you ship. | Change Failure Rate (CFR), Mean Time to Recovery (MTTR). | Ensures that speed doesn't come at the cost of system health, preventing customer-facing outages. |
| Business Impact | The tangible value your engineering work delivers to the company and its users. | Time to Value, Feature Adoption Rate, Customer Satisfaction (CSAT). | Connects engineering effort directly to business outcomes, ensuring you're building what matters. |
| Team Health | The well-being and sustainability of your engineering team. | Developer Satisfaction, Retention Rate, Burnout Risk. | Protects your most valuable asset—your people—by fostering a sustainable and motivating work environment. |
By tracking metrics across all four categories, you avoid the tunnel vision that comes from optimizing for a single goal. Now, let's dig a little deeper into each pillar.
Pillar 1: Speed and Throughput
This pillar gets straight to the point: "How fast can we deliver value?" It measures the velocity of your pipeline, from the moment a developer commits code to the second it's live for customers. Speed is a direct reflection of your team’s agility.
The DORA framework offers some fantastic, research-backed metrics to track here:
- Deployment Frequency: How often do you successfully release to production? Elite teams often deploy multiple times a day.
- Lead Time for Changes: How long does it take for a committed piece of code to get into users' hands? Shorter lead times mean a more efficient and less risky process.
Tracking speed helps you pinpoint bottlenecks in your CI/CD pipeline and smooth out your entire workflow. You can dive deeper into structuring this by exploring various software development metrics that support these goals.
Pillar 2: Quality and Stability
This pillar asks the all-important question: "How reliable is our work?" Shipping features fast is pointless if they’re riddled with bugs that crash the system. This is all about the stability of your releases and the overall health of your codebase.
High quality doesn't slow you down; it speeds you up. When teams ship reliable code, they spend less time firefighting and more time building new features. Quality is the foundation upon which sustainable speed is built.
Two other DORA metrics are perfect for measuring quality:
- Change Failure Rate (CFR): What percentage of your deployments cause a production failure? A low CFR is a great sign of a mature testing and review process.
- Mean Time to Recovery (MTTR): When a failure does happen, how fast can you fix it? A low MTTR shows your team can diagnose and resolve problems efficiently.
Pillar 3: Business Impact
This is where the rubber meets the road. This pillar answers: "Is our work actually creating value for the business?" It forces a shift in thinking from output (how many features we shipped) to outcomes (did those features improve customer value or business growth?).
Without this pillar, engineering can easily become an isolated function, building technically impressive things that nobody actually uses. Tracking business impact ensures your team’s precious time is spent on work that truly moves the needle.
Metrics to consider here include:
- Time to Value: How long after deployment does a feature start delivering real value, like revenue or user engagement?
- Feature Adoption Rate: What percentage of users are actively engaging with a new feature?
- Customer Satisfaction (CSAT): How do your releases impact user happiness?
Pillar 4: Team Health
Finally, and maybe most importantly, this pillar asks: "Is our performance sustainable?" High-performing teams aren't machines. They're made up of creative, talented people. Driving for speed and quality at the expense of their well-being is a surefire recipe for burnout, low morale, and high turnover.
A healthy team is engaged, collaborative, and motivated. Tracking team health gives you a leading indicator of problems before they start tanking productivity. It's about building an environment where developers can do their best work for the long haul.
While these metrics are often more qualitative, they are just as critical:
- Developer Satisfaction: Are your developers happy? Regular surveys can uncover friction points in your process.
- Retention Rate: A low turnover rate is one of the strongest signals of a positive and healthy engineering culture.
- Burnout Risk: Are developers constantly working nights and weekends? This is an early warning sign of an unsustainable pace.
How to Implement a Metrics Program That Works
Knowing what engineering performance indicators are is one thing. Actually putting them to use in your team is a whole different ball game. It’s easy to feel like it’s a massive leap, but the secret is to treat it less like a top-down mandate and more like a collaborative project for the whole team.
A successful program is always built on trust and a shared goal: making things better for everyone.
The absolute most critical piece of the puzzle is psychological safety. Your team has to believe that these metrics are a flashlight, not a hammer. They’re here to shine a light on system-wide bottlenecks and help celebrate improvements, never to judge individuals or create competitive leaderboards.
Secure Team Buy-In First
Before you even think about tracking a single number, you have to get your team on board. This always starts with the "why." You need to clearly explain that the goal is to make everyone's work life easier by finding and smoothing out the rough spots in your development process.
Try framing the whole thing around questions that actually matter to your engineers:
- "Are we spending way too much time waiting around for builds to finish or for reviews to happen?"
- "How can we cut down on the number of production fires that keep pulling us away from building cool stuff?"
- "What can we do to make our release days smoother and a lot less stressful?"
When your team sees the program as a tool that helps them, they’ll jump in as active partners instead of feeling like they’re being watched. That collaborative spirit is what fuels a healthy, data-informed culture.
Start Small and Be Consistent
Look, don't try to boil the ocean by rolling out a dozen different metrics all at once. The best way to get started is by picking a few foundational indicators that are easy to grasp and offer immediate insights.
The DORA metrics are the perfect place to start:
- Deployment Frequency: How often do we ship code? It’s a straightforward measure of your team’s throughput.
- Lead Time for Changes: How long does it take to get from a commit to a live deployment? This metric quickly highlights inefficiencies in your process.
Just start there. Establish a baseline for these two. Simply collecting and visualizing this data is a huge win. Once you know where you stand, you can work with the team to set small, realistic goals for improvement. The real key here is consistency. Make a habit of reviewing these metrics regularly, maybe in your bi-weekly retrospectives.
The goal of a new metrics program isn't to hit world-class numbers overnight. The goal is to build a rhythm of measurement, reflection, and small, iterative improvements. Think progress, not perfection.
Automate Data Collection
Doing this by hand is a recipe for disaster. Manual data collection is a soul-crushing, error-prone task that wastes precious engineering time. To make sure your engineering performance indicators are accurate and trusted, automation is non-negotiable.
Use tools that plug right into your existing workflows, pulling data directly from your version control and CI/CD systems. This hands-off approach gives you objective, real-time data that everyone can trust. It also reinforces the idea that the metrics are an impartial look at the system, not a subjective judgment of the people working in it. Automation frees your team to focus on what really matters: figuring out what the data is telling you and deciding what to do about it.
Understanding these internal metrics also helps you navigate what’s happening in the wider world. For instance, the engineering services sector is sensitive to big economic shifts. Having solid internal data helps teams set realistic benchmarks and adapt when things get turbulent.
And while this guide is all about engineering, these core ideas apply everywhere. Knowing how to track essential recruitment KPIs, for example, can uncover insights into your hiring process that directly support the growth and health of your engineering team.
Evolving Beyond Traditional DORA Metrics
While the four DORA metrics give us a solid baseline for speed and stability, the best engineering teams are already pushing past them. They get that a complete performance picture means looking beyond pure output. The conversation is shifting from “how fast did we ship?” to something far more important: “how quickly did our work actually create value for our customers?”
This is a huge step. We're moving from measuring velocity to measuring impact. It’s an admission that deploying code ten times a day is pointless if those deployments don't solve real problems or make the user's life better. This deeper level of analysis is what truly connects engineering effort to business success.
The whole field of engineering analytics is heading this way. In fact, one of the biggest emerging trends is the pivot toward business outcomes. By 2025, it's predicted that metrics like 'time to value' will eclipse more traditional measures. This reflects a more mature take on performance—one that measures the speed of customer impact, not just the speed of deployment.
From Velocity to Value
The most important evolution happening right now in engineering performance is the focus on Time to Value (TTV). This metric tracks the entire journey from the spark of an idea to the moment a customer gets a real, tangible benefit from a new feature. It forces teams to think beyond their deployment pipeline and look at the entire value stream.
A low TTV is a sign that your organization isn't just technically efficient but is also deeply in sync with what customers need. It proves you can identify a problem, build a solution, and get it into users' hands with minimal drag. Getting this right requires tight collaboration between product, design, and engineering, making it a powerful indicator of your entire organization's health.
Measuring the Developer Experience
Another critical frontier is measuring the Developer Experience (DX). For years, we’ve all known that happy, productive developers do better work. Now, organizations are finally finding real ways to quantify this, moving beyond simple satisfaction surveys.
The goal is to find and kill all the friction in a developer's daily workflow. I’m talking about all those small, frustrating hurdles that pile up, causing major delays and draining motivation.
- Time spent waiting: How much of a developer's day is just gone, wasted waiting on slow CI builds, complex local environment setups, or backed-up code reviews?
- Cognitive load: How hard is it to just understand the codebase, find the right documentation, or track down the right person to ask a question?
- Tooling efficiency: Do your tools feel integrated and helpful, or are they a clunky mess that just gets in the way?
Improving the developer experience isn't just about morale; it has a direct, measurable impact on productivity and quality. When developers can stay in a state of flow, they write better code, faster. This is also where understanding and implementing continuous integration best practices can make a night-and-day difference by slashing friction and wait times.
A world-class developer experience acts as a performance multiplier. By removing daily frustrations and streamlining workflows, you unlock your team's full potential, leading to faster innovation and higher-quality outcomes without pushing for more hours.
The Role of AI in Uncovering Bottlenecks
Finally, the arrival of AI-powered analytics is starting to show us hidden patterns in our workflows that standard metrics have always missed. A traditional dashboard might show you that a bottleneck exists—like a sudden spike in lead time—but it rarely explains why.
AI can chew through massive amounts of data from your version control, project management tools, and CI/CD pipelines to pinpoint the real root causes of inefficiency. It can spot patterns like a specific type of complex code review that always slows down a release, or identify flaky tests that randomly fail and derail the whole CI process. This gives teams specific, actionable insights to fix the underlying problems, not just the symptoms.
Automating Measurement with CI Insights
Trying to gather engineering performance indicators manually is like trying to measure rainfall with a thimble. It’s slow, tedious, and the data you collect is almost guaranteed to be incomplete and off the mark. When teams are stuck in spreadsheets and running manual queries, they're not solving problems—they're doing admin work. This whole approach also opens the door to human error and bias, which kills any trust in the very metrics meant to guide you.
The only way to get accurate, objective insights without driving yourself crazy is through automation. When you build measurement directly into your workflow, you get a system that captures data in real time, no manual effort required. This doesn't just lift the administrative burden; it gives you a single source of truth that shows what's actually happening in your development pipeline.
To get the most out of automating these insights, it helps to have a solid grasp of the basics. If you're building out a metrics program, digging into what is CI/CD and why it's needed is a great way to firm up your foundation.
Transforming Data with Integrated Tooling
This is exactly where tools like Mergify’s CI Insights come in. It’s not some separate, bolted-on dashboard you have to constantly feed with data. It lives right inside your CI/CD process, automatically observing every pull request and workflow run. It captures everything needed to track key engineering performance indicators without you having to change a single line of your pipeline configuration.
This tight integration turns raw, noisy workflow data into clear, actionable trends. It crunches the numbers for core DORA metrics and other critical indicators, presenting them in a way that makes immediate sense.
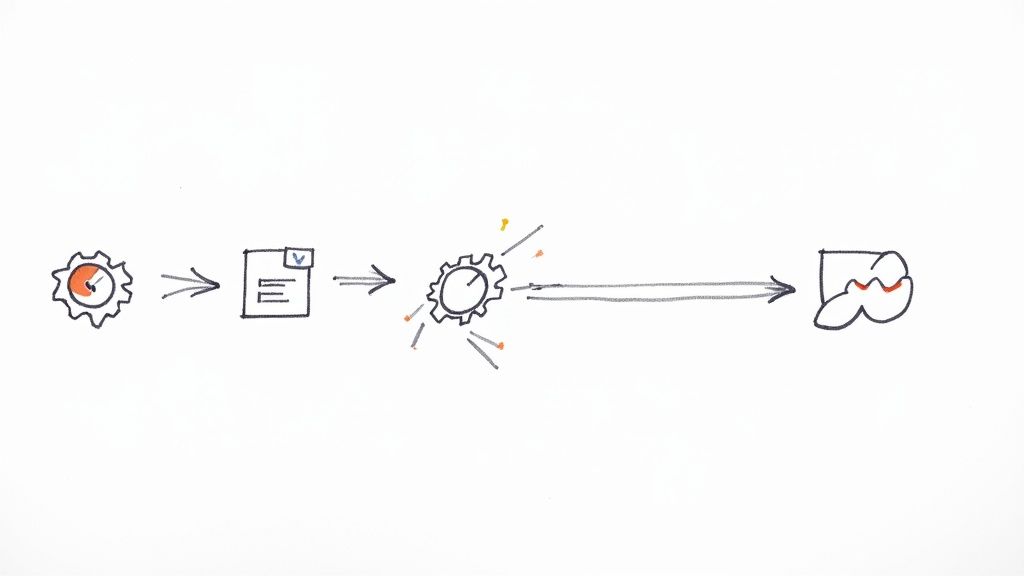
Here’s a glimpse of how a CI Insights dashboard can visualize your team's performance over time.
The dashboard instantly surfaces trends in deployment frequency, lead time, and failure rates. With a single glance, you can spot performance regressions or see the positive effects of a process improvement.
Gaining Instant Visibility for Better Decisions
With automated measurement, your team gets instant visibility into the health of its delivery process. You can finally move from reactive firefighting to proactive optimization.
- Identify Regressions Quickly: Did your lead time suddenly spike last week? An automated dashboard flags it immediately. Now you can dig into the root cause—maybe a new testing stage or a complex merge—before it becomes a chronic headache.
- Celebrate Improvements: When you introduce a change, like adding a merge queue to smooth out integrations, you see the positive impact on your metrics right away. This creates a powerful feedback loop that validates your team's efforts and keeps everyone motivated.
- Make Data-Driven Choices: Instead of guessing where the bottlenecks are, you have objective data to guide your decisions. The conversation shifts from, "I think we're slow," to, "Our lead time has increased by 15%; let's look at the data to see why."
The biggest win with automated measurement is that it makes your performance data a natural part of the team's daily conversation. It stops being a report you glance at once a month and becomes a living, breathing tool for continuous improvement.
Ultimately, automating your engineering performance indicators is about much more than saving time. It’s about building a culture of transparency and making informed decisions. You can learn more about how this connects to broader team goals in our essential developer productivity metrics guide. When you give your team the tools to see their impact clearly, you empower them to own their processes and consistently push performance forward.
Common Questions About Engineering Metrics
Let's be honest—when you start talking about tracking engineering performance, questions pop up. It’s only natural for teams to be curious, and maybe even a little skeptical, about how these metrics will actually affect their day-to-day work.
Getting ahead of these concerns is the best way to build trust and make sure everyone is on the same page. Here are some of the most common questions we hear when teams start this journey.
Will These Metrics Be Used for Individual Performance Reviews?
This is always the first, and most important, question. The answer should be a hard no. Engineering performance indicators are meant to diagnose the health of your systems and processes—not to grade individual engineers.
The moment you tie metrics like Deployment Frequency or Change Failure Rate to someone's performance review, you've lost. It creates a culture of fear, encouraging developers to "game the system" to make their personal numbers look good, which completely undermines the goal of improving as a team. Think of these as diagnostic tools for the team, not a report card for individuals.
The moment metrics become a weapon for performance reviews, they lose all value as a tool for genuine process optimization. They must remain a shared resource for the team to identify bottlenecks and celebrate collective wins.
How Do We Start If We Are Not Tracking Anything Today?
Don't try to boil the ocean. The key is to start small and keep it simple. If you try to implement a dozen new metrics all at once, you'll just create noise and confusion.
Instead, pick one or two of the foundational DORA metrics to get a quick, powerful snapshot of your pipeline's health. We recommend starting with:
- Deployment Frequency: This tells you how often you’re successfully pushing code to production.
- Lead Time for Changes: This measures the time it takes from a code commit to that code being live.
Focus on getting a solid baseline for just these two. Once you have a clear picture of where you stand, you can bring the team together to set realistic goals for improvement.
Which Metrics Are the Most Important to Track?
There’s no magic bullet here. The most important factor isn't a single metric—it's balance. If you focus only on one or two indicators, you'll get a skewed picture of reality. For example, chasing speed at all costs will almost certainly cause your quality to nose-dive.
The DORA metrics are a fantastic starting point because they're designed to measure both speed and stability. But as your team matures, you’ll want to build a more holistic view. This means layering in indicators that connect your work to business impact (like feature adoption) and team health (like developer satisfaction). This ensures your performance isn't just fast, but also effective and sustainable.
Ready to stop guessing and start measuring? Mergify's CI Insights gives you automated, real-time visibility into your team's performance without the manual busywork. See how you can transform your CI/CD data into actionable improvements.