Top DevOps Performance Metrics to Boost Your Workflow


Unlocking DevOps Success with the Right Metrics
This listicle presents eight essential DevOps performance metrics your team should monitor to improve and achieve DevOps excellence. We'll cover key metrics like deployment frequency, lead time for changes, mean time to recovery (MTTR), and change failure rate. You'll also learn about crucial application performance, infrastructure metrics, automated test coverage, and how these relate to customer satisfaction and business impact. Tracking these DevOps performance metrics provides insights into your development pipeline, identifies bottlenecks, and enables data-driven optimization for peak performance.
1. Deployment Frequency
Deployment Frequency is a crucial DevOps performance metric that measures how often an organization successfully releases code to production. It serves as a key indicator of development velocity, team efficiency, and the organization's ability to deliver value to customers quickly. A higher deployment frequency generally signifies more mature DevOps practices, robust automated processes, and a streamlined software development lifecycle. It signifies an organization's capability to adapt rapidly to changing market demands and incorporate user feedback efficiently. Tracking and improving Deployment Frequency are vital for organizations aiming to stay competitive and deliver high-quality software at speed.
This metric tracks successful production releases over a defined period, such as daily, weekly, or monthly. The choice of timeframe depends on the organization's specific context and goals. While some organizations might track daily deployments, others with longer release cycles might opt for a weekly or monthly measurement. This flexibility allows teams to tailor the metric to their specific release cadence. Regardless of the chosen timeframe, the underlying principle remains the same: more frequent deployments, when coupled with quality controls, correlate to faster delivery of value. Understanding the nuances of implementing and interpreting Deployment Frequency is critical for leveraging its full potential.
Deployment Frequency doesn't merely measure the speed of deployments; it reflects the maturity of the underlying processes and the efficiency of the teams involved. A high Deployment Frequency suggests a well-oiled DevOps machine with robust automation, efficient testing, and streamlined deployment pipelines. Conversely, low Deployment Frequency can highlight bottlenecks in the development process, inadequate automation, or insufficient testing practices. Learn more about Deployment Frequency The metric offers valuable insights into areas for improvement and helps organizations pinpoint specific areas that require attention to enhance their overall DevOps performance.
Several industry giants exemplify the power of high Deployment Frequency. Netflix, with its microservices architecture, deploys thousands of times per day, allowing them to constantly innovate and deliver new features to their vast user base. Amazon, renowned for its rapid innovation, performs deployments every 11.7 seconds on average, showcasing an unparalleled level of automation and efficiency. Etsy's journey from weekly to multiple daily deployments highlights the transformative impact of embracing DevOps practices. Similarly, Google deploys code changes multiple times per day, enabling them to continuously improve their services and respond quickly to market demands. These examples demonstrate that high Deployment Frequency is achievable and beneficial for organizations across various industries.
While a high Deployment Frequency is generally desirable, it's crucial to balance speed with quality. Simply increasing the frequency without adequate quality controls can lead to an increase in defects and instability in production. Furthermore, focusing solely on Deployment Frequency can create pressure on teams to release prematurely, compromising the quality and stability of the software. It's also essential to consider the complexity and size of deployments; deploying a small bug fix is different from deploying a major feature overhaul. Therefore, Deployment Frequency should not be considered in isolation but paired with other crucial metrics, such as change failure rate and mean time to recovery, to provide a holistic view of DevOps performance.
To effectively leverage Deployment Frequency, start by measuring the current deployment frequency to establish a baseline. This initial assessment provides a starting point for improvement and allows teams to track their progress over time. Focus on automating key processes, such as testing, deployment, and rollback procedures, to enable frequent and safe deployments. Implementing feature flags allows decoupling deployment from release, enabling teams to deploy code to production without immediately exposing it to users. Using deployment strategies like blue-green or canary deployments can significantly reduce the risk associated with frequent releases. Most importantly, pair Deployment Frequency with quality metrics to ensure that the pursuit of speed doesn't compromise the stability and reliability of the software. The DORA (DevOps Research and Assessment) team, through the State of DevOps Report and the Accelerate book by Forsgren, Humble, and Kim, has popularized the importance of Deployment Frequency as a key DevOps performance metric. By understanding and implementing these tips, organizations can harness the power of Deployment Frequency to accelerate their software delivery, improve team efficiency, and deliver value to customers faster.
2. Lead Time for Changes
Lead Time for Changes is a crucial DevOps performance metric that measures the time elapsed between committing code and successfully deploying it to a production environment. This metric provides a valuable insight into the efficiency of your entire software delivery pipeline, revealing bottlenecks and highlighting areas for improvement. A shorter lead time signifies a more streamlined and efficient process, enabling faster delivery of value to customers and a quicker feedback loop for continuous improvement. This makes it a cornerstone of effective DevOps practices and a key indicator of overall DevOps maturity.

This metric encompasses all stages of the delivery pipeline, from code integration and build processes, through testing and staging environments, to final deployment in production. By tracking the time spent in each phase, you can pinpoint bottlenecks that hinder rapid delivery. For example, lengthy testing cycles, manual approval processes, or complex deployment procedures can significantly increase lead time. Identifying and addressing these issues is key to optimizing your delivery pipeline and achieving faster release cycles.
Lead Time for Changes is an indispensable metric for any organization striving for efficient software delivery. Its utility stems from several key features: it provides a comprehensive measure of end-to-end delivery pipeline efficiency, accurately tracks time from initial commit to production deployment, effectively identifies bottlenecks within the development and deployment process, and serves as a valuable indicator of overall DevOps maturity. This metric is more than just a number; it is a reflection of your organization’s ability to rapidly respond to market changes, deliver value to customers, and iterate on feedback.
Benefits and Drawbacks
The benefits of tracking Lead Time for Changes are numerous. It provides clear visibility into the efficiency of your delivery pipeline, enabling data-driven decisions to optimize the flow. By pinpointing bottlenecks and inefficiencies, teams can focus their efforts on streamlining processes and removing roadblocks. Shorter lead times naturally lead to faster feedback cycles, allowing for quicker iteration and continuous improvement. This enhanced agility translates to greater customer satisfaction and increased business competitiveness.
However, accurately measuring Lead Time for Changes across complex systems can be challenging. Different types of changes, varying in complexity and scope, might require different handling, making a unified measurement approach difficult. Furthermore, the pressure to reduce lead time can sometimes compromise the thoroughness of testing, potentially leading to quality issues down the line. Successfully implementing this metric requires mature tooling, robust process tracking, and a commitment to continuous improvement.
Real-World Successes
Several organizations have demonstrably benefitted from focusing on Lead Time for Changes. Spotify, known for its agile engineering practices, reduced their lead time from weeks to hours through extensive automation. Similarly, ING Bank drastically decreased lead time from months to days by embracing a DevOps transformation. Capital One, a leader in the financial services industry, optimized their pipeline to achieve a 90% reduction in deployment lead time. Target, a major retailer, streamlined its delivery process to achieve an astounding reduction in lead time, from 9 months to a mere 40 minutes for certain deployments.
Actionable Tips for Implementation
To effectively utilize Lead Time for Changes, start by meticulously mapping your entire value stream, identifying key measurement points throughout the delivery process. Automate the tracking process by leveraging integrated toolchains that seamlessly connect different stages of the pipeline. Focus on reducing handoffs between teams and minimizing wait times between processes. Implementing trunk-based development can significantly reduce delays caused by complex branch merges. Utilize value stream mapping to visualize the entire flow and identify areas ripe for optimization.
Origin and Popularity
The concept of Lead Time for Changes was popularized by the DORA (DevOps Research and Assessment) team, whose research consistently highlights its correlation with high-performing IT organizations. The metric is also rooted in Lean software development principles, which emphasize minimizing waste and maximizing flow. The annual State of DevOps Report has further cemented its importance as a key performance indicator for DevOps success. By prioritizing Lead Time for Changes, organizations can embark on a journey of continuous improvement, unlocking faster delivery, enhanced agility, and increased customer satisfaction.
3. Mean Time to Recovery (MTTR)
Mean Time to Recovery (MTTR) is a crucial DevOps performance metric that measures the average time it takes to restore service after a production incident or failure. It encompasses the entire process, from initial incident detection to complete resolution and service restoration. This metric is a key indicator of system resilience, the effectiveness of your incident response processes, and the overall maturity of your DevOps practices. A lower MTTR signifies a more robust and responsive system, leading to improved customer satisfaction and business continuity. It directly reflects the ability of your team to quickly identify, diagnose, and rectify issues impacting your production environment. In the fast-paced world of software development and delivery, minimizing downtime is paramount, making MTTR a critical metric to track and optimize.

MTTR is calculated by taking the total duration of all downtime periods within a specific timeframe and dividing it by the number of incidents that occurred during that period. For instance, if you experienced three incidents last month resulting in a combined downtime of 3 hours, your MTTR would be 1 hour. This metric includes the time spent on detection, diagnosis, remediation, and verification before declaring the issue resolved. It is important to track the entire timeline accurately to gain a comprehensive understanding of your recovery capabilities.
Features of MTTR:
- Measures average recovery time: Provides a quantifiable measure of how long it takes to recover from incidents.
- Includes detection, diagnosis, and resolution time: Captures the entire incident lifecycle, providing a holistic view of response effectiveness.
- Reflects incident response process maturity: A lower MTTR generally indicates a more mature and streamlined incident management process.
- Critical for understanding system resilience: Highlights the robustness of your systems and their ability to withstand and recover from failures.
Pros of Tracking MTTR:
- Directly impacts customer experience and satisfaction: Minimizing downtime keeps customers happy and builds trust.
- Measures effectiveness of monitoring and alerting systems: Quick detection is key to minimizing MTTR.
- Encourages investment in automation and tooling: Automating tasks like rollback and failover can drastically reduce recovery time.
- Helps justify disaster recovery and monitoring investments: Demonstrates the ROI of these crucial systems.
Cons of Tracking MTTR:
- May encourage quick fixes over proper root cause analysis: Focusing solely on speed can lead to overlooking underlying issues.
- Doesn't distinguish between different types of incidents: A minor bug fix and a major system outage might have very different resolution times.
- Can be gamed by prematurely declaring incidents resolved: Accuracy in tracking resolution is essential for meaningful MTTR data.
- Requires consistent incident classification and tracking: Standardized procedures are needed to ensure data reliability.
Examples of Successful MTTR Implementation:
- Google: Aims for an MTTR of less than 30 minutes for critical services, emphasizing their commitment to rapid recovery and minimal user disruption.
- Netflix: Uses chaos engineering to proactively test their systems' resilience and improve MTTR through practice and continuous improvement.
- Uber: Achieved a 75% reduction in MTTR through improved monitoring and automation, demonstrating the significant impact of these investments.
- LinkedIn: Decreased MTTR from hours to minutes by implementing better tooling and streamlining incident response procedures.
Tips for Improving MTTR:
- Implement comprehensive monitoring and alerting systems: Proactive monitoring helps detect incidents early.
- Create clear incident response procedures and train teams: Well-defined processes ensure efficient handling of incidents.
- Use automated rollback capabilities for quick recovery: Automate the reversal of changes to quickly restore service.
- Conduct regular incident response drills and chaos engineering: Practice makes perfect, and simulated incidents help prepare teams for real-world scenarios.
- Maintain updated runbooks and troubleshooting guides: Provide easy access to relevant information for faster resolution.
Popularized By:
- ITIL framework: ITIL best practices emphasize incident management and service restoration.
- Site Reliability Engineering (SRE) practices: SRE focuses on building highly reliable and resilient systems.
- DORA research team: DORA's research has established MTTR as a key DevOps performance metric.
By focusing on MTTR, development teams can build more resilient systems, improve customer satisfaction, and ensure business continuity. It is a valuable metric for understanding the effectiveness of incident response processes and driving continuous improvement in DevOps practices.
4. Change Failure Rate
Change Failure Rate (CFR) is a crucial DevOps performance metric that measures the percentage of deployments to production that result in a failure requiring immediate remediation. This remediation could involve a rollback to a previous version, applying a hotfix, or implementing an emergency patch. Tracking CFR allows organizations to balance the speed of deployments with the quality of the delivered software, ensuring that rapid releases don't compromise stability. A lower CFR generally indicates more mature development, testing, and deployment practices. This metric is essential for understanding how effectively your team is delivering value to users without introducing instability.
CFR focuses specifically on failures that have a direct impact on users and require immediate action. This differs from simply tracking all bugs or errors. For example, a minor visual glitch might be logged as a bug but not necessarily contribute to the CFR if it doesn't require immediate intervention. By focusing on impactful failures, CFR provides a clearer picture of the overall health and stability of the delivery pipeline.
Several factors contribute to a high CFR. Insufficient testing, inadequate code reviews, poorly designed deployment processes, and a lack of automated quality gates can all lead to more frequent failures in production. Conversely, organizations with robust testing pipelines, comprehensive code review processes, and sophisticated deployment strategies tend to have lower CFRs.
Implementing CFR effectively involves several key steps. First, establish a clear definition of what constitutes a "failure" requiring remediation. This definition should be consistent across teams and aligned with the organization's risk tolerance. Next, invest in comprehensive automated testing, including unit, integration, and end-to-end tests, to catch issues early in the development cycle. Feature flags can also be invaluable for reducing the blast radius of changes by enabling teams to roll out new features gradually and disable them quickly if issues arise. Thorough code reviews and pair programming can further enhance code quality and prevent errors from reaching production.
Monitoring CFR alongside deployment frequency offers a balanced perspective on DevOps performance. A high deployment frequency coupled with a low CFR indicates a healthy and efficient delivery pipeline. However, a high deployment frequency with a high CFR suggests that speed is being prioritized over quality, potentially jeopardizing user experience and long-term stability.
Many leading technology companies leverage CFR as a key performance indicator. Google, for example, strives to maintain a CFR below 5% for most of its services, demonstrating a strong commitment to quality and stability. Facebook utilizes gradual rollouts and sophisticated monitoring systems to minimize the impact of change failures. Microsoft and Atlassian have also reported significant reductions in their CFRs through improved testing and code review practices.
The following bar chart compares change failure rates across three performance tiers: Elite, High, and Medium.
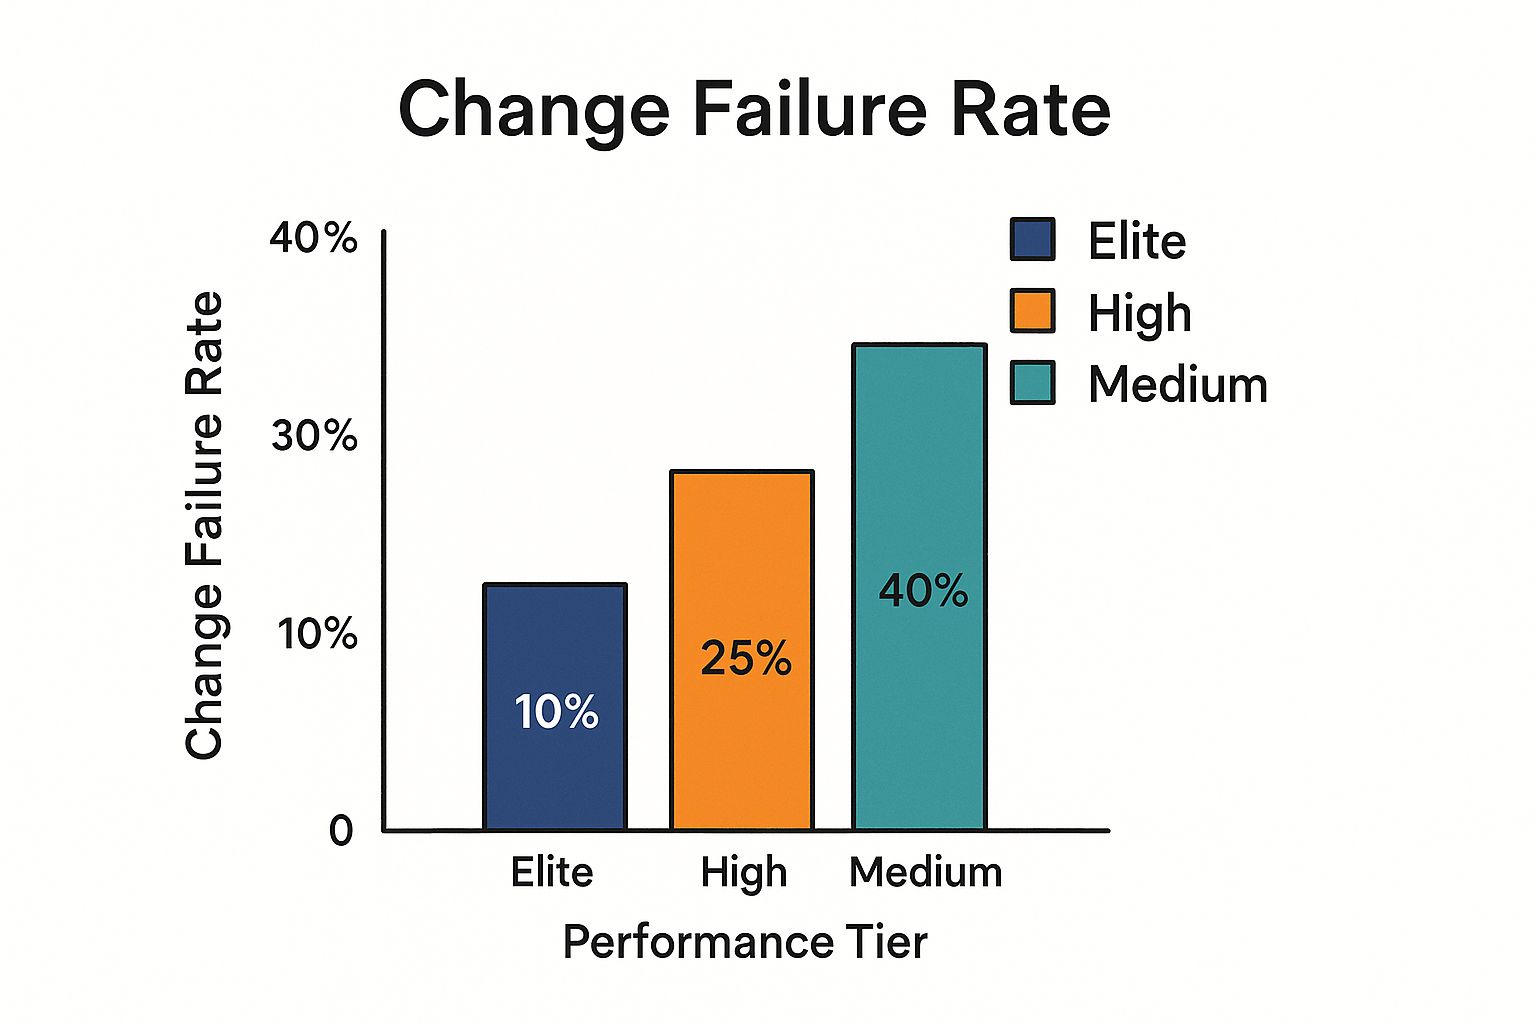
As the chart illustrates, Elite performers maintain a significantly lower change failure rate (10%) compared to High performers (25%) and Medium performers (40%). This visualization highlights the correlation between a low CFR and high-performing DevOps practices.
While aiming for a low CFR is essential, it's crucial to avoid becoming overly risk-averse. An excessively low tolerance for failure can stifle experimentation and innovation. Finding the right balance between speed and stability is key to maximizing the benefits of DevOps. By carefully tracking CFR and implementing the appropriate mitigation strategies, organizations can accelerate their delivery cycles while maintaining high levels of quality and reliability. This ultimately leads to improved user satisfaction, faster time to market, and a more competitive edge in today’s rapidly evolving digital landscape.
5. Application Performance Monitoring (APM) Metrics
Application Performance Monitoring (APM) metrics are crucial DevOps performance metrics providing a deep dive into the health, performance, and user experience of your applications in a live production environment. In the fast-paced world of software development, understanding how your applications behave under real-world conditions is paramount. APM tools provide this crucial visibility, allowing teams to proactively identify and resolve performance bottlenecks, ultimately leading to a smoother and more efficient user experience. This makes APM a critical component of any robust DevOps strategy.
APM goes beyond basic infrastructure monitoring. While understanding server CPU and memory usage is important, APM delves into the application itself, tracking metrics such as response times, throughput, error rates, and resource utilization. This granular level of detail allows teams to pinpoint specific areas for optimization, rather than relying on guesswork or reacting only after users experience problems. For any team aiming to deliver high-performing, reliable software, incorporating APM into their DevOps workflow is essential.
How APM Works:
APM tools typically work by instrumenting your application code. This instrumentation allows the tool to capture performance data at various points within the application's execution flow. This data is then aggregated and analyzed to provide insights into application behavior. Many APM solutions offer visualizations like dashboards and charts to represent the data in a digestible format. Advanced APM tools also leverage machine learning algorithms to detect anomalies and predict potential performance issues before they impact users.
Features and Benefits of APM:
APM tools provide a suite of features designed to offer a comprehensive view of application performance:
- Response Time and Throughput Monitoring: Track how quickly your application responds to user requests and how many requests it can handle per unit of time. This data is crucial for identifying bottlenecks and optimizing application performance.
- Error Rate and Exception Tracking: Monitor the frequency and types of errors occurring within your application. This helps identify problematic code segments and prioritize bug fixes.
- Resource Utilization Measurement: Gain insights into how your application consumes resources like CPU, memory, disk I/O, and network bandwidth. This information is valuable for optimizing resource allocation and scaling decisions.
- Real-time Visibility: APM dashboards provide a real-time view of application health, allowing teams to quickly identify and react to performance issues.
Pros of Utilizing APM:
- Proactive Issue Identification: Detect performance problems before they impact users, preventing negative experiences and potential revenue loss.
- Detailed User Experience Insights: Understand how users interact with your application and identify areas for improvement in the user journey.
- Optimized Resource Allocation: Make informed decisions about resource allocation and scaling based on actual application usage patterns.
- Data-Driven Performance Improvements: Use APM data to identify and prioritize performance optimization efforts, ensuring maximum impact.
Cons of Utilizing APM:
- Data Overload: APM tools can generate massive amounts of data, which can be overwhelming without proper filtering and analysis.
- Tooling Investment and Expertise: Implementing and managing APM tools requires significant investment in both the tooling itself and the expertise to use it effectively.
- Performance Overhead: The instrumentation required for APM can introduce a small amount of overhead that can potentially impact application performance if not configured carefully.
- Complexity in Distributed Systems: Setting up and maintaining APM across complex, distributed systems can be challenging.
Examples of Successful APM Implementations:
Numerous organizations have leveraged APM to significantly improve their application performance and user experience. Examples include:
- Airbnb: Uses APM to optimize search response times and booking flows, crucial for a smooth and efficient user experience.
- Twitter: Monitors API response times to ensure the high availability and responsiveness of its platform.
- Shopify: Tracks transaction performance during high-traffic events like Black Friday, ensuring a seamless shopping experience for customers.
- Slack: Monitors message delivery latency and system responsiveness to maintain its reputation for real-time communication.
Actionable Tips for Implementing APM:
- Focus on User Experience: Prioritize metrics that directly impact user experience, such as response times and error rates.
- Set up Alerts: Configure alerts based on performance thresholds and trends to proactively address potential issues.
- Distributed Tracing: Utilize distributed tracing for microservices architectures to gain insights into complex transaction flows.
- Correlate with Business Metrics: Connect performance metrics with business metrics to understand the impact of performance on revenue and user engagement.
- Synthetic Monitoring: Implement synthetic monitoring to proactively detect issues by simulating user interactions.
Popular APM Tools:
Several leading APM solutions are available on the market, including:
- New Relic: newrelic.com
- AppDynamics: appdynamics.com
- Dynatrace: dynatrace.com
- Datadog: datadog.com
By incorporating APM metrics into your DevOps strategy, you gain the necessary insights to proactively address performance bottlenecks, enhance user experience, and optimize resource utilization. APM is a critical investment for any organization that prioritizes delivering high-performing, reliable, and scalable applications.
6. Infrastructure Monitoring Metrics
Infrastructure Monitoring Metrics are crucial DevOps performance metrics that provide insights into the health, performance, and availability of your underlying infrastructure. This includes everything from physical servers and virtual machines to containers, networks, and cloud resources. These metrics are fundamental to maintaining system reliability, optimizing resource utilization, and preventing infrastructure-related outages that can negatively impact application performance and user experience. By focusing on these key metrics, DevOps teams can ensure a stable and performant foundation for their applications.
A robust infrastructure monitoring strategy allows you to track key performance indicators (KPIs) across your entire infrastructure. This encompasses monitoring CPU usage, memory consumption, disk I/O, network bandwidth, and system availability/uptime. For containerized environments, it also extends to monitoring the health of containers and orchestration platforms like Kubernetes. If you're leveraging cloud services, visibility into resource consumption, costs, and the performance of cloud-specific services becomes essential. This holistic view allows for proactive management and helps prevent performance bottlenecks.
Effective infrastructure monitoring empowers teams to identify and address potential issues before they escalate into major problems. For example, if CPU usage on a particular server consistently exceeds a defined threshold, the monitoring system can trigger an alert, allowing the team to investigate and rectify the situation before it impacts application performance. Similarly, monitoring network latency can help identify network bottlenecks or connectivity issues that could affect user experience.
Several organizations have successfully implemented comprehensive infrastructure monitoring strategies. Netflix, for example, monitors thousands of microservices across its vast cloud infrastructure, allowing them to maintain high availability and deliver seamless streaming experiences to millions of users. Kubernetes deployments often utilize Prometheus, a popular open-source monitoring system, for comprehensive container monitoring and alerting. Similarly, cloud providers offer integrated monitoring tools such as AWS CloudWatch, Google Cloud's Stackdriver (now Google Cloud Operations Suite), and Azure Monitor, giving users deep visibility into their cloud resource utilization and performance.
To effectively leverage infrastructure monitoring metrics, consider the following actionable tips:
- Establish baseline metrics: By establishing baseline performance metrics, you can effectively identify anomalies and deviations that may indicate potential issues. This allows you to differentiate between normal fluctuations and genuine problems.
- Infrastructure as Code (IaC): Use IaC to ensure consistent monitoring setup across your infrastructure. This eliminates manual configuration and reduces the risk of inconsistencies and errors.
- Automated scaling: Implement automated scaling based on utilization metrics. If CPU or memory usage reaches a predefined threshold, automatically scale up your resources to handle the increased load. Conversely, scale down resources during periods of low activity to optimize costs.
- Correlate infrastructure metrics with application performance: Connect the dots between infrastructure performance and the end-user experience. Correlating infrastructure metrics with application performance data provides a holistic view of system health and helps pinpoint the root cause of performance issues.
- Predictive alerts: Leverage trend analysis to set up predictive alerts. This proactive approach allows you to anticipate potential problems before they occur, giving you time to implement preventative measures.
While the benefits are numerous, it's important to be aware of potential drawbacks. One common challenge is alert fatigue, which occurs when teams are bombarded with excessive low-level alerts, often leading to important alerts being overlooked. Furthermore, interpreting and acting on infrastructure data requires expertise, and the sheer volume of data can be overwhelming. Finally, infrastructure metrics may not always directly correlate with business impact, requiring careful analysis and interpretation. It’s important to remember that regular tuning of thresholds and alerting rules is necessary to maintain an effective monitoring strategy.
Learn more about Infrastructure Monitoring Metrics
Choosing the right tools is a critical part of any infrastructure monitoring strategy. The Prometheus and Grafana ecosystem has become increasingly popular for its open-source flexibility and powerful visualization capabilities. Established monitoring systems like Nagios continue to provide valuable insights, while cloud providers offer integrated solutions that simplify monitoring within their respective platforms. Commercial tools like Datadog and New Relic provide comprehensive monitoring and analytics capabilities. The key is to select tools that align with your specific needs and integrate seamlessly with your existing infrastructure. Implementing effective infrastructure monitoring, as a core component of your DevOps performance metrics, will undoubtedly enhance the stability, performance, and reliability of your applications and services.
7. Automated Test Coverage and Success Rate
Automated Test Coverage and Success Rate are crucial DevOps performance metrics that provide insights into the effectiveness and comprehensiveness of your testing strategy. They measure the extent to which your codebase is covered by automated tests and the frequency with which these tests pass successfully. These metrics are essential for maintaining high code quality, enabling faster and more confident deployments, and underpinning successful continuous integration and continuous delivery (CI/CD) pipelines. High test coverage coupled with consistently high success rates signify mature development practices and a reduced risk of defects making their way into production. This directly impacts business outcomes, minimizing disruptions and maximizing user satisfaction.
In essence, Automated Test Coverage quantifies what percentage of your code is actively being tested by your automated test suite. This is typically expressed as a percentage. For instance, 80% test coverage means that 80% of your codebase is executed during the test runs. Success Rate, on the other hand, measures the percentage of those tests that consistently pass. A 95% success rate means that, on average, 95 out of 100 automated tests execute without failure. Monitoring these metrics in tandem allows teams to assess both the breadth and the robustness of their testing efforts.
Automated Test Coverage and Success Rate encompass different testing levels:
- Unit Tests: These tests focus on individual components or modules in isolation, ensuring each part functions correctly independently.
- Integration Tests: These tests verify the interaction between different units or modules, ensuring they work seamlessly together.
- End-to-End (E2E) Tests: These tests simulate real-world user scenarios, testing the entire application flow from start to finish. They ensure all components work together harmoniously to deliver the desired functionality.
Monitoring test execution time and efficiency is also a vital aspect of these metrics. While comprehensive testing is important, overly long test suites can slow down the development cycle. Therefore, optimizing test execution time is key to maintaining a rapid development pace while ensuring quality.
Several industry leaders have demonstrated the effectiveness of comprehensive automated testing strategies. Google, known for its robust and reliable services, maintains exceptionally high test coverage through rigorous automated testing practices. Facebook leverages automated testing to support multiple deployments per day, ensuring rapid feature delivery while maintaining stability. Similarly, Spotify uses comprehensive test suites for their microservices architecture, guaranteeing the seamless interaction of numerous independent services. Amazon, a pioneer in continuous deployment, relies heavily on automated testing in their pipelines to achieve rapid and reliable releases.
There are several compelling reasons to prioritize Automated Test Coverage and Success Rate as key DevOps performance metrics. These metrics facilitate frequent and confident deployments by providing a safety net against regressions. They significantly reduce the need for time-consuming and error-prone manual testing, freeing up QA engineers to focus on more exploratory and strategic testing activities. Automated tests provide rapid feedback on code changes, allowing developers to identify and rectify issues early in the development cycle. This, in turn, supports refactoring and code improvement initiatives by providing the confidence that changes won't introduce unintended consequences.
However, it's important to be aware of the potential pitfalls. High test coverage alone doesn't guarantee the quality or relevance of the tests. Poorly designed tests can create a false sense of security, even with high coverage. If test maintenance becomes burdensome, it can slow down development. Furthermore, achieving 100% test coverage is often impractical and might not be cost-effective, especially for larger and more complex projects.
To effectively leverage Automated Test Coverage and Success Rate, consider the following tips:
- Focus on critical business logic and user workflows: Prioritize testing the most important aspects of your application to maximize the impact of your testing efforts.
- Maintain a test pyramid: Aim for a higher number of unit tests than integration tests, and fewer E2E tests. This helps to ensure a balanced and efficient testing strategy.
- Implement Test-Driven Development (TDD) practices: Write tests before writing the code to ensure testability and drive design decisions.
- Regularly review and refactor test suites for maintainability: Keep tests concise and focused to avoid test bloat and ensure they remain relevant and easy to understand.
- Use mutation testing: Go beyond code coverage and assess the effectiveness of your tests in detecting actual defects.
The concepts of Automated Test Coverage and Success Rate have been popularized by methodologies like Extreme Programming (XP) and Test-Driven Development (TDD), as well as by continuous integration pioneers like Martin Fowler. Learn more about Automated Test Coverage and Success Rate. By focusing on these metrics and implementing robust automated testing strategies, development teams can significantly improve code quality, accelerate delivery cycles, and enhance overall software reliability.
8. Customer Satisfaction and Business Impact Metrics
While optimizing technical processes is a cornerstone of DevOps, its ultimate goal is to deliver tangible business value and enhance the customer experience. This is where Customer Satisfaction and Business Impact Metrics come into play. These metrics bridge the gap between technical improvements and their impact on the bottom line, demonstrating how DevOps practices translate into meaningful results for the business and its users. This makes them a crucial component of any comprehensive DevOps performance measurement strategy. By focusing on these metrics, organizations can ensure that their DevOps initiatives are not just technically sound but also contribute directly to business success and customer delight.
Customer Satisfaction and Business Impact Metrics focus on quantifying the effects of DevOps practices on key areas like user engagement, retention, conversion rates, and overall business KPIs. Instead of solely measuring deployment frequency or lead time for changes, this approach examines how those improvements affect the end-user and the organization's strategic objectives. This provides a holistic view of DevOps performance, going beyond technical efficiency to encompass the true value delivered.
This approach involves tracking various indicators, including:
- Net Promoter Score (NPS): This metric gauges customer loyalty and their likelihood to recommend your product or service to others. A higher NPS suggests greater customer satisfaction and positive word-of-mouth marketing.
- Customer Satisfaction Score (CSAT): This measures customer satisfaction with specific interactions, features, or overall experience with your product or service. It provides direct feedback on how customers perceive the quality and usability of your software.
- User Engagement Metrics: These metrics assess how users interact with your software, including metrics like active users, session duration, feature usage, and conversion rates. They offer insights into user behavior and identify areas for improvement in the user experience.
- Business KPIs: These are key performance indicators specific to your business, such as revenue growth, market share, customer acquisition cost, and customer lifetime value. By correlating these KPIs with DevOps performance, you can demonstrate the direct impact of technical improvements on business outcomes.
Examples of Successful Implementation:
Several organizations have effectively integrated Customer Satisfaction and Business Impact Metrics into their DevOps strategies. For example, Amazon meticulously correlates improvements in page load times with increases in sales, demonstrating the tangible business value of performance optimization. Etsy measures how deployment frequency affects seller satisfaction, recognizing that frequent updates can impact their users' workflow and experience. Booking.com tracks conversion rate improvements resulting from faster deployments, highlighting the link between agility and business outcomes. Similarly, Zillow monitors user engagement improvements stemming from reliability initiatives, showcasing the importance of stable and performant software for customer retention.
Actionable Tips for Implementation:
- Establish Clear Connections: Define clear relationships between technical metrics (e.g., deployment frequency, lead time for changes) and business outcomes (e.g., conversion rates, revenue). This helps demonstrate the value of DevOps investments.
- Use A/B Testing: Employ A/B testing to measure the impact of specific DevOps improvements on customer behavior and business metrics. This provides empirical data to support decision-making.
- Regular Customer Surveys: Conduct regular customer surveys to gather feedback on their experience with your software. This provides valuable insights into customer needs and areas for improvement.
- Unified Dashboards: Create dashboards that display both technical and business metrics side-by-side, enabling stakeholders to easily understand the correlation between them.
- Stakeholder Involvement: Involve business stakeholders in defining success criteria for DevOps initiatives, ensuring alignment between technical efforts and business objectives.
Pros and Cons:
Pros:
- Directly links DevOps practices to business value.
- Provides strong justification for DevOps investments.
- Ensures a customer-centric focus in technical decisions.
- Helps prioritize improvements based on customer impact.
Cons:
- Can be challenging to directly attribute specific business outcomes solely to DevOps practices.
- Feedback loops can be longer compared to technical metrics.
- Requires integration of multiple data sources and systems.
- Business metrics can be influenced by numerous external factors.
When and Why to Use This Approach:
Customer Satisfaction and Business Impact Metrics are particularly valuable when demonstrating the ROI of DevOps initiatives, justifying investments in new tools and processes, and aligning technical teams with business goals. They are essential for organizations that prioritize customer experience and want to ensure their DevOps efforts are delivering tangible value to both customers and the business. By incorporating these metrics, organizations can move beyond simply measuring technical efficiency and focus on the ultimate goal of DevOps: delivering exceptional customer experiences and driving business success.
Key DevOps Performance Metrics Comparison
| Metric | Implementation Complexity 🔄 | Resource Requirements ⚡ | Expected Outcomes 📊 | Ideal Use Cases 💡 | Key Advantages ⭐ |
|---|---|---|---|---|---|
| Deployment Frequency | Medium - requires CI/CD automation | Moderate - investment in tooling | Increased release velocity and rapid value delivery | Fast-paced environments needing continuous delivery | Encourages frequent feedback, reduces risk via small releases |
| Lead Time for Changes | High - end-to-end pipeline tracking | High - integrated toolchains needed | Reduced cycle time, identifies bottlenecks | Continuous integration pipelines | Improves process efficiency, enables faster iteration |
| Mean Time to Recovery (MTTR) | Medium - requires monitoring & incident management | Moderate - incident detection systems | Faster recovery from failures, improved system resilience | Incident response and reliability management | Directly impacts customer satisfaction, improves recovery processes |
| Change Failure Rate | Medium - clear failure definitions needed | Moderate - automated testing required | Balanced speed and stability | Quality control alongside rapid deployments | Ensures deployment quality, prevents instability |
| APM Metrics | High - complex setup and maintenance | High - advanced monitoring tools | Real-time app health visibility, proactive issue detection | Application performance optimization | Provides detailed user experience insights, supports optimization |
| Infrastructure Monitoring Metrics | Medium - requires expertise and tuning | Moderate - monitoring tools | Infrastructure health and availability, resource optimization | Infrastructure reliability and capacity planning | Prevents outages, supports cost optimization |
| Automated Test Coverage & Success Rate | Medium - test automation frameworks | Moderate - test suite development | Confidence in code quality, reduced defects | Continuous integration and delivery pipelines | Enables fast feedback, reduces manual testing |
| Customer Satisfaction & Business Impact | High - data integration and correlation | High - requires cross-functional data | Aligns technical efforts with customer and business value | Business-focused DevOps measurement | Connects technical metrics to business outcomes |
Driving DevOps Maturity with Continuous Measurement
Mastering DevOps performance metrics is crucial for any organization aiming to optimize its software development lifecycle. From deployment frequency and lead time for changes to MTTR and change failure rate, consistently tracking these metrics provides a clear picture of your DevOps pipeline's health. Moreover, integrating application and infrastructure monitoring, automated testing, and, critically, tying these to business impact and customer satisfaction metrics, allows teams to understand the real-world consequences of their efforts. While this listicle focuses on DevOps performance metrics, similar principles apply to other industries. For example, understanding the key drivers of performance is crucial in all sectors, and even retail businesses rely on retail performance indicators to measure success and identify areas for improvement, as discussed in the 2025 Retail Performance Indicators: Boost Sales from Theory House. In the world of software development, the insights gleaned from DevOps performance metrics enable data-driven decision-making, leading to more efficient processes, faster delivery cycles, and ultimately, greater business value.
The key takeaway here is that a proactive approach to measurement is essential. Don't just collect these DevOps performance metrics – analyze them, learn from them, and iterate on your processes based on the data. By embracing this continuous improvement cycle, you can drive DevOps maturity within your organization and achieve a competitive edge in today’s rapidly evolving digital landscape.
Ready to streamline your merge workflow and boost your DevOps performance? Explore how Mergify can automate your pull request management and enhance your ability to track and improve key DevOps metrics. Start optimizing your CI/CD pipeline today!